|

XRP price kick-starts 80% ascent, retest of 2018 highs likely

  • XRP price broke out of a symmetrical triangle pattern on November 2.
  • The retest of $1.137 confirms the start of an upswing to $2.
  • A breakdown of the $1.05 support floor will invalidate the bullish thesis for Ripple.

XRP price action over the past two months has been lackluster, to stay the least. On November 2, this outlook changed as Ripple bulls breached a crucial resistance barrier that kick-started a potential bull rally.

XRP price reveals bullish signs

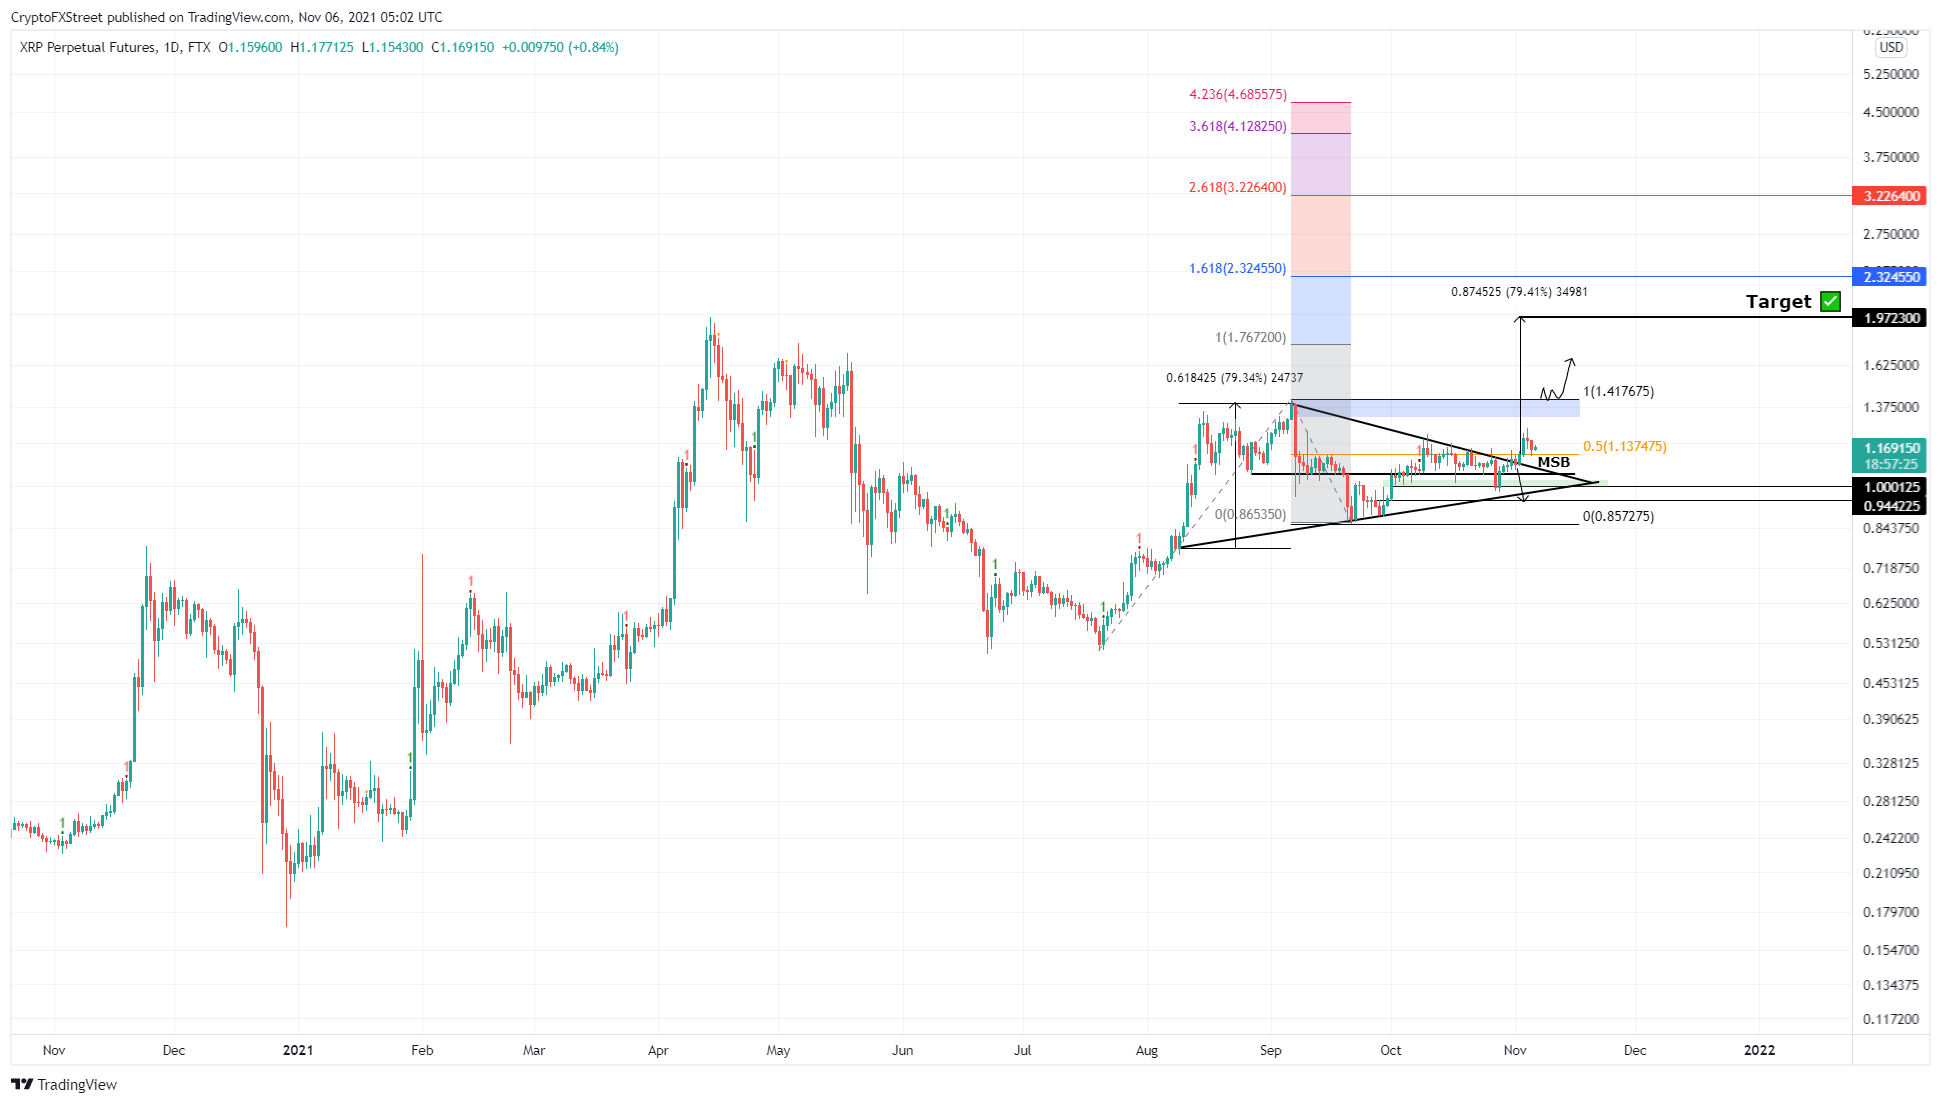
XRP price set up multiple lower highs and higher lows starting August 8. Connecting these swing points using trend lines reveals the formation of a symmetrical triangle. This technical formaiton forecasts an 80% ascent to $1.97, obtained by adding the distance between the first swing high and swing low to the breakout point at $1.1.

Although XRP price breached the upper trend line of this setup, a daily close above the 50% Fibonacci retracement level at $1.13 adds credibility to the upswing. Therefore, investors can expect Ripple to continue its ascent to the next crucial barrier at $1.41. 

If the buyers manage to push XRP price above this level and hold it there, it will indicate a significant milestone and further strengthen the move to $2. 

The climb to $2 is just the start as the uptrend could extend to 161.8% trend-based Fibonacci extension at $2.32. In a highly bullish case, however, XRP price could move to retest the $3 psychological level or the all-time highs at $3.31.
XRP/USDT 1-day chart

XRP/USDT 1-day chart

While XRP price looks bullish, it needs to hold above the $1.13 support floor to have any chance at an upswing. A breach of this barrier will knock the remittance token down to $1.05. Here, the buyers can try to make a comeback. However, a daily close below this barrier will invalidate the symmetrical triangle’s bullish thesis.

Author

Akash Girimath

Akash Girimath is a Mechanical Engineer interested in the chaos of the financial markets. Trying to make sense of this convoluted yet fascinating space, he switched his engineering job to become a crypto reporter and analyst.


More from Akash Girimath
Share:

Editor's Picks

Pepe Price Forecast: PEPE signals trend reversal amid a short squeeze

Pepe price is up nearly 30% in the last 24 hours, outperforming most top cryptocurrencies and hinting at further upside potential. Derivatives data suggest a short squeeze of more than $2 million during the same period, forcing traders to buy back positions in the meme coin. The technical outlook for PEPE indicates an upside bias as bullish momentum strengthens.

Crypto Overview: Bitcoin tops $85,000 post-CLARITY Act failure – TAO and FET lead gains

Bitcoin price trades above $85,000 maintaining a constructive tone amid positive institutional inflows, Strategy’s first BTC purchase since August, and alternative regulatory expansions following the CLARITY Act's failure. AI tokens such as Bittensor (TAO) and FET have emerged as top performers over the last 24 hours.

Ripple and Stellar outlook: Momentum improves as bulls target further gains

Ripple (XRP) and Stellar (XLM) stabilize after extending their gains by nearly 9% at the start of the week. Improving momentum indicators support XRP and XLM bullish price action and hint at further rally. Meanwhile, traders should remain cautious as mixed derivatives data could limit upside as both tokens try to sustain their recent upswing.

Ethereum Price Forecast: ETH rallies above $2,700 as investors shrug off bearish sentiment

Ethereum climbed above $2,700 on Monday after investors defended the realized price level despite negative sentiment over the Clarity Act's failure and the Federal Reserve rate hike. After the Clarity Act failed to advance in the Senate, ETH dipped below $2,400 last week. But right below that price is the top altcoin's realized price, or average on-chain cost basis, at $2,310.

Bitcoin: BTC shrugs off CLARITY Act setback and hawkish Fed
Bitcoin (BTC) price action has remained resilient this week, trading above $78,000 at the time of writing on Friday, heading toward a key resistance zone. Institutional demand shows early signs of weakness, with spot Exchange Traded Funds (ETFs) on track for a second straight week of outflows, with over $420 million recorded through Thursday amid escalating Middle East tensions.