- XRP price has been consolidating for the past few weeks, unable to offer indicative moves in either direction.
- Ripple could be vulnerable to further losses as it continues to see obstacles ahead.
- Further selling pressure could spell trouble for XRP bulls, as the asset could be awaiting a 12% drop.
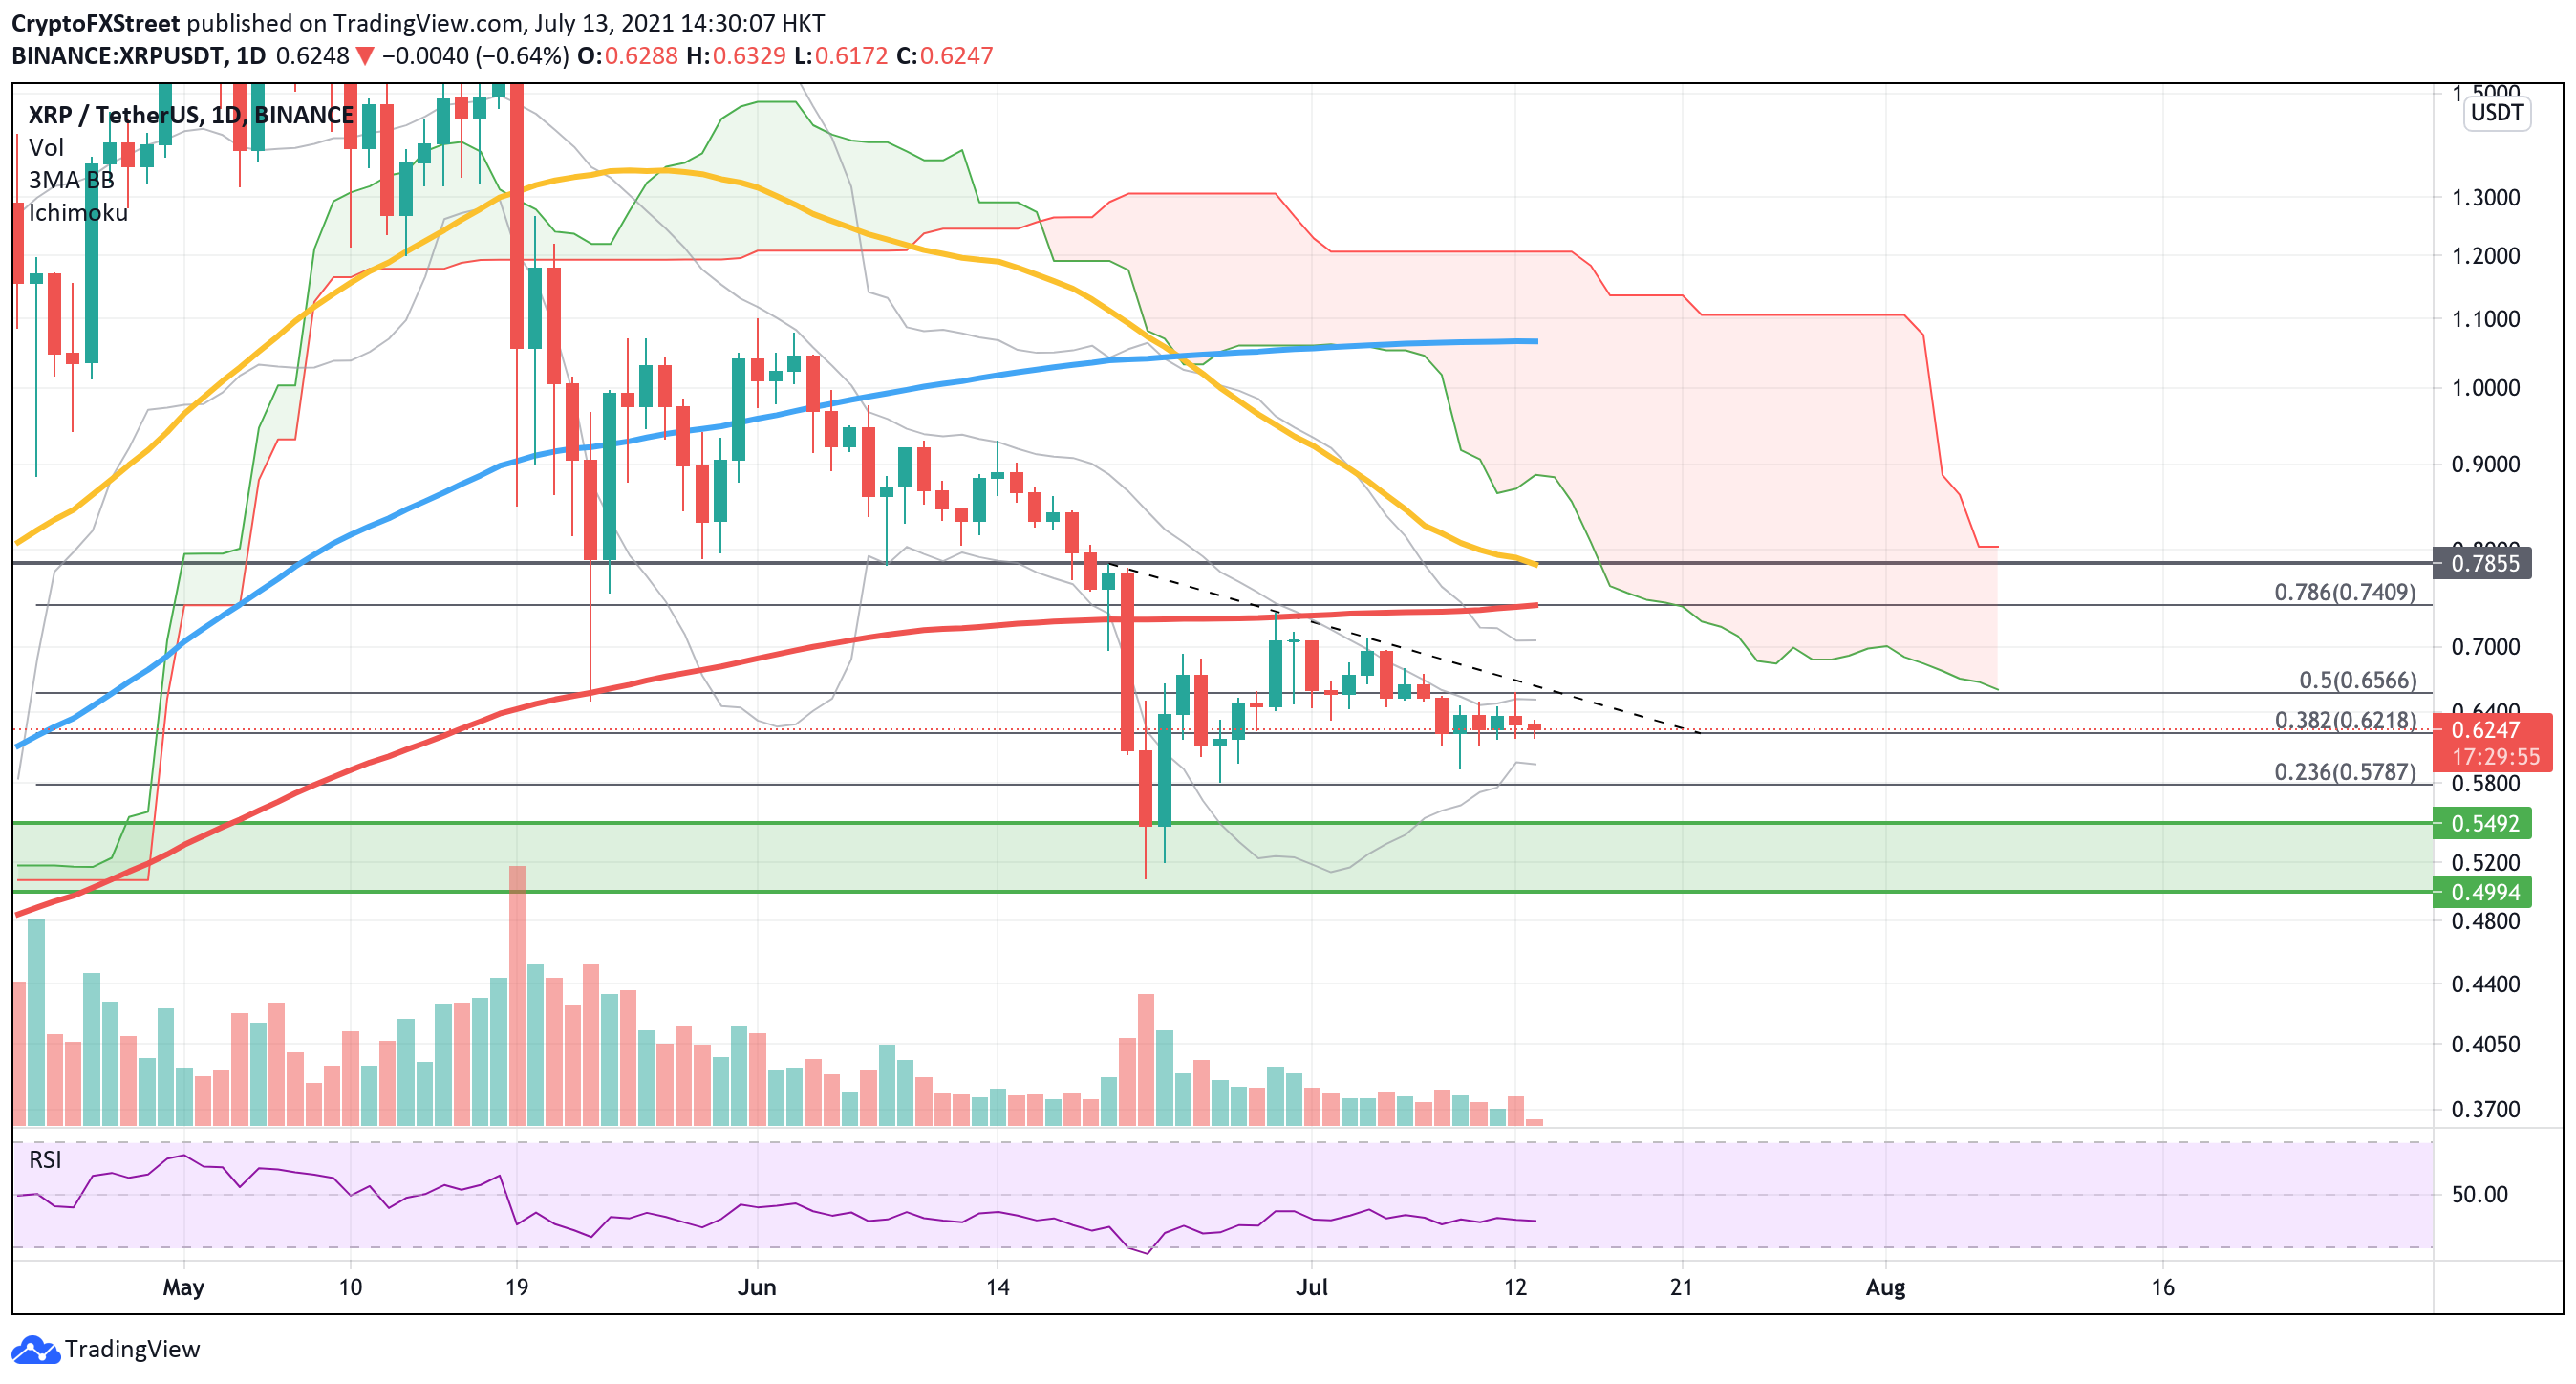
XRP price action has been muted in the past few days, with minimal clues as to directional intentions. Ripple has formed a declining resistance trend line since mid-June and could be expecting higher volatility following the period of stagnation.
XRP price weighed down by heavy resistances
XRP price has been forming lower highs, presenting a declining resistance trend line on the daily chart since June 21. Ripple has attempted to recoup losses from its monthly low on June 22 and has been trading sideways since. The squeezing of the Bollinger Bands suggests that a period of high volatility may be in store for the asset.
Ripple was unable to break above the 200-day Simple Moving Average (SMA), which has sealed XRP price in consolidation, struggling to find bullish momentum as trading volume has also tapered off.
The lack of buying pressure and the heightened resistance is spelling trouble for the bulls. The Ichimoku Cloud indicator that shows collective support and resistance levels indicates that XRP price is in a downtrend for the foreseeable future.
Further, the thickness of the cloud also represents the heavy resistance XRP price is facing, which may lock Ripple in a bearish trend.
XRP/USDT daily chart
Additional selling pressure and market-wide weakness may cause XRP price to retest crucial support levels before falling further. The 38.2% Fibonacci extension level at $0.62 is acting as support for Ripple.
However, it is likely that the token could drop to the 23.6% Fibonacci extension level at $0.58 as the recent rebound has channeled minimal interest. Speculators should also be aware of the impending death cross when the 50-day SMA intersects below the 200-day SMA.
Should further downward momentum emerge, XRP price is at risk of falling at least 12% into the demand zone, which ranges from $0.50 to $0.55.
On the flip side, to void the bearish outlook, XRP bulls would need to break above the aforementioned diagonal trend line to confirm accelerating interest. Ripple could aim to tag the 200-day SMA, which coincides with the 78.6% Fibonacci extension level at $0.74, if this bullish outlook transpires.
Note: All information on this page is subject to change. The use of this website constitutes acceptance of our user agreement. Please read our privacy policy and legal disclaimer. Opinions expressed at FXstreet.com are those of the individual authors and do not necessarily represent the opinion of FXstreet.com or its management. Risk Disclosure: Trading foreign exchange on margin carries a high level of risk, and may not be suitable for all investors. The high degree of leverage can work against you as well as for you. Before deciding to invest in foreign exchange you should carefully consider your investment objectives, level of experience, and risk appetite. The possibility exists that you could sustain a loss of some or all of your initial investment and therefore you should not invest money that you cannot afford to lose. You should be aware of all the risks associated with foreign exchange trading, and seek advice from an independent financial advisor if you have any doubts.
Recommended Content
Editors’ Picks
Could Worldcoin price shoot up 45% ahead of OpenAI’s live stream on Monday?

Worldcoin has formed a double bottom around a key support level, suggesting a potential accumulation. If the OpenAI’s Monday live stream has a positive impact on Artificial Intelligence field, it could positively impact WLD and other AI-based tokens.
Here’s what needs to happen for The Graph price to revisit $0.422

The Graph price trades inside the $0.192 to $0.494 range. Investors need to wait for GRT to overcome $0.343 before being bullish on GRT. If successful, GRT could rally 50% and revisit the $0.422 hurdle. A decisive daily candlestick close below $0.192 will invalidate the bullish thesis.
SingularityNET price could bounce 30% if AGIX can hold this level

SingularityNET price has been consolidating around the bottom of the $0.903 to $1.475 range for nearly a month. With some AI-tokens showing signs of revival, AGIX needs to be enalyzed for potential breakout opportunities like Arkham (ARKM).
Arkham price primed for a recovery rally ahead of OpenAI’s announcement

Arkham price eyes a potential reversal as it clears key hurdles. ARKM likely to rally 27% if it can overcome $2.74 resistance level. A breakdown of $2.28 wil invalidate the bullish thesis for the AI-based token.
Bitcoin: Why BTC is close to a bottom

Bitcoin (BTC) price efforts of a recovery this week have been countered by selling pressure during the onset of the American session. However, the downside potential appears to have been capped. Markets have noted significant trading differences between sessions, and while the Asian market showed strength, whatever ground they were able to cover was oftentimes wiped out by traders in the US.
