• XRP price re-attempts 21-DMA barrier but bullish potential appears limited.
  • Impending bear cross on the 4H chart keeps the sellers hopeful.
  • The path of least resistance appears down despite the tepid bounce.

XRP price is trading almost unchanged on the day around $0.6200, alternating between gains and losses so far this Sunday.

In doing so, Ripple's price is wavering within Saturday’s trading range, finding some support from a renewed bid wave that grips the crypto market in the last hour.  

Despite the Securities and Exchange Commission [SEC] several attempts to prove XRP as an unregistered security, the US regulator’s failure to provide crucial evidence questioning Ripple’s utility keeps the downside cushioned in XRP/USD (for now).

How is XRP price positioned on the technical graph?

The XRP price is consolidating in a narrow range, with a test of the bearish 21-Simple Moving Average (SMA) at $0.6247 now underway.

Should the XRP bulls find a strong foothold above the latter, a fresh upswing towards the $0.6510-$0.6520 region cannot be ruled.

That supply zone is nearly where the 100 and 50-SMAs coincide.

Further up, the buyers would flex their muscles to reach out to the $0.6600 round number.

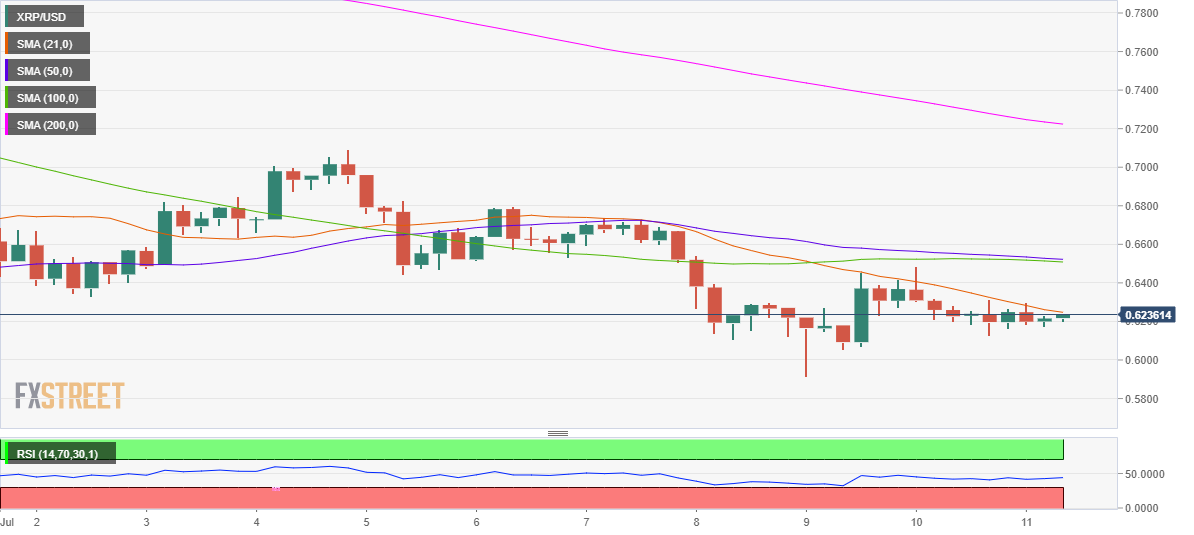
XRP/USD: Four-hour chart

However, with the Relative Strength Index (RSI) still trending below the central line, the downside bias is likely to remain in place.

Adding credence to the recent downtrend, the 50-SMA is on the verge of cutting the 100-SMA from above, which if confirmed could chart a bear cross – a bearish signal.

Subsequently, the immediate downside target is seen at $0.60000, the psychological level.

Next of relevance remains the July 9 low at $0.5917, which is expected to offer some respite to the XRP bulls.

XRP/USD: Additional technical levels to consider

XRP/USD

Overview
Today last price 0.6237
Today Daily Change -0.0012
Today Daily Change % -0.19
Today daily open 0.6249
 
Trends
Daily SMA20 0.6469
Daily SMA50 0.8012
Daily SMA100 1.0639
Daily SMA200 0.7352
 
Levels
Previous Daily High 0.6485
Previous Daily Low 0.6127
Previous Weekly High 0.7093
Previous Weekly Low 0.5917
Previous Monthly High 1.0999
Previous Monthly Low 0.5099
Daily Fibonacci 38.2% 0.6264
Daily Fibonacci 61.8% 0.6348
Daily Pivot Point S1 0.6089
Daily Pivot Point S2 0.5929
Daily Pivot Point S3 0.573
Daily Pivot Point R1 0.6447
Daily Pivot Point R2 0.6645
Daily Pivot Point R3 0.6805


Information on these pages contains forward-looking statements that involve risks and uncertainties. Markets and instruments profiled on this page are for informational purposes only and should not in any way come across as a recommendation to buy or sell in these assets. You should do your own thorough research before making any investment decisions. FXStreet does not in any way guarantee that this information is free from mistakes, errors, or material misstatements. It also does not guarantee that this information is of a timely nature. Investing in Open Markets involves a great deal of risk, including the loss of all or a portion of your investment, as well as emotional distress. All risks, losses and costs associated with investing, including total loss of principal, are your responsibility. The views and opinions expressed in this article are those of the authors and do not necessarily reflect the official policy or position of FXStreet nor its advertisers. The author will not be held responsible for information that is found at the end of links posted on this page.

If not otherwise explicitly mentioned in the body of the article, at the time of writing, the author has no position in any stock mentioned in this article and no business relationship with any company mentioned. The author has not received compensation for writing this article, other than from FXStreet.

FXStreet and the author do not provide personalized recommendations. The author makes no representations as to the accuracy, completeness, or suitability of this information. FXStreet and the author will not be liable for any errors, omissions or any losses, injuries or damages arising from this information and its display or use. Errors and omissions excepted.

The author and FXStreet are not registered investment advisors and nothing in this article is intended to be investment advice.

Join Telegram

Recommended content


Recommended Content

Editors’ Picks

Ethereum dips slightly amid Renzo depeg, BlackRock spot ETH ETF amendment

Ethereum dips slightly amid Renzo depeg, BlackRock spot ETH ETF amendment

Ethereum (ETH) suffered a brief decline on Wednesday afternoon despite increased accumulation from whales. This follows Ethereum restaking protocol Renzo restaked ETH (ezETH) crashing from its 1:1 peg with ETH and increased activities surrounding spot Ethereum ETFs.

More Ethereum News

Injective price weakness persists despite over 5.9 million INJ tokens burned

Injective price weakness persists despite over 5.9 million INJ tokens burned

Injective (INJ) price is trading with a bearish bias, stuck in the lower section of the market range. The bearish outlook abounds despite the network's deflationary efforts to pump the price. Coupled with broader market gloom, INJ token’s doomed days may not be over yet.

More Injective News

US intensifies battle against crypto privacy protocols following crackdown on Samourai Wallet

US intensifies battle against crypto privacy protocols following crackdown on Samourai Wallet

CEO Keonne Rodriguez and CTO William Lonergan of Samourai Wallet were arrested by the US Department of Justice (DoJ) on Wednesday and charged with $100 million in money laundering on a count and illegal money transmitting on another count. This move could see privacy-focused cryptocurrencies take a dip.

More Cryptocurrencies News

Near Protocol Price Prediction: NEAR fulfills targets but a 10% correction may be on the horizon

Near Protocol Price Prediction: NEAR fulfills targets but a 10% correction may be on the horizon

Near Protocol price has completed a 55% mean reversal from the bottom of the market range at $4.27. Amid growing bearish activity, NEAR could drop 10% to the $6.00 psychological level before a potential recovery. A break and close above $7.95 would invalidate the downleg thesis.

More Near Protocol News

Bitcoin: BTC post-halving rally could be partially priced in Premium

Bitcoin: BTC post-halving rally could be partially priced in

Bitcoin (BTC) price briefly slipped below the $60,000 level for the last three days, attracting buyers in this area as the fourth BTC halving is due in a few hours. Is the halving priced in for Bitcoin? Or will the pioneer crypto note more gains in the coming days? 

Read full analysis

BTC

ETH

XRP