- XRP traders have realized $130.24 million in losses since the beginning of January as Ripple price declines.
- XRP active addresses have decreased by 34% since January 1, signaling a decrease in demand and relevance of the altcoin.
- XRP price is at risk of a fall to $0.50, a 9% drop from the current level.
XRP price is in a downward trend that has shed around a quarter of the altcoin’s value in the last few months. The price decline came even as the community anticipates the approval of a Spot XRP ETF after the recent approval of the Bitcoin ETFs by the SEC. Still, investors with XRP holdings have realized losses in large numbers in January, on-chain data shows, putting Ripple’s token on the path for another 9% decline if the current trajectory persists.
XRP holders realize over $130 million in losses
According to on-chain data from crypto intelligence provider Santiment, XRP holders have realized $130.24 million in losses since January 1.
In this period, there have been consistent spikes in the Network Realized Profit/Loss metric that indicate traders are realizing losses.
Network Realized Profit/ Loss. Source: Santiment
XRP’s active addresses are also on a decline, as seen on Santiment data. There is a 34% decrease in Ripple’s active addresses between since the beginning of the year. This signals a drop in demand and activity of XRP holders.
XRP active addresses. Source: Santiment
XRP price at risk of 9% decline
XRP price is in a downward trend that started on November 13. Since then, XRP price suffered a 26.94% decline. At the time of writing, XRP trades below its three long-term 10-day, 50-day, and 200-day Exponential Moving Averages (EMAs), at $0.5688, $0.5956, and $0.5713, respectively.
If falls persist, XRP price could find support at $0.5429, the 23.6% Fibonacci retracement level of the decline seen from July to August. In the event of a further drop in the asset’s price, XRP could hit the upper boundary of the bullish imbalance zone at $0.5007, as seen in the chart, a 9% drop from the current price.
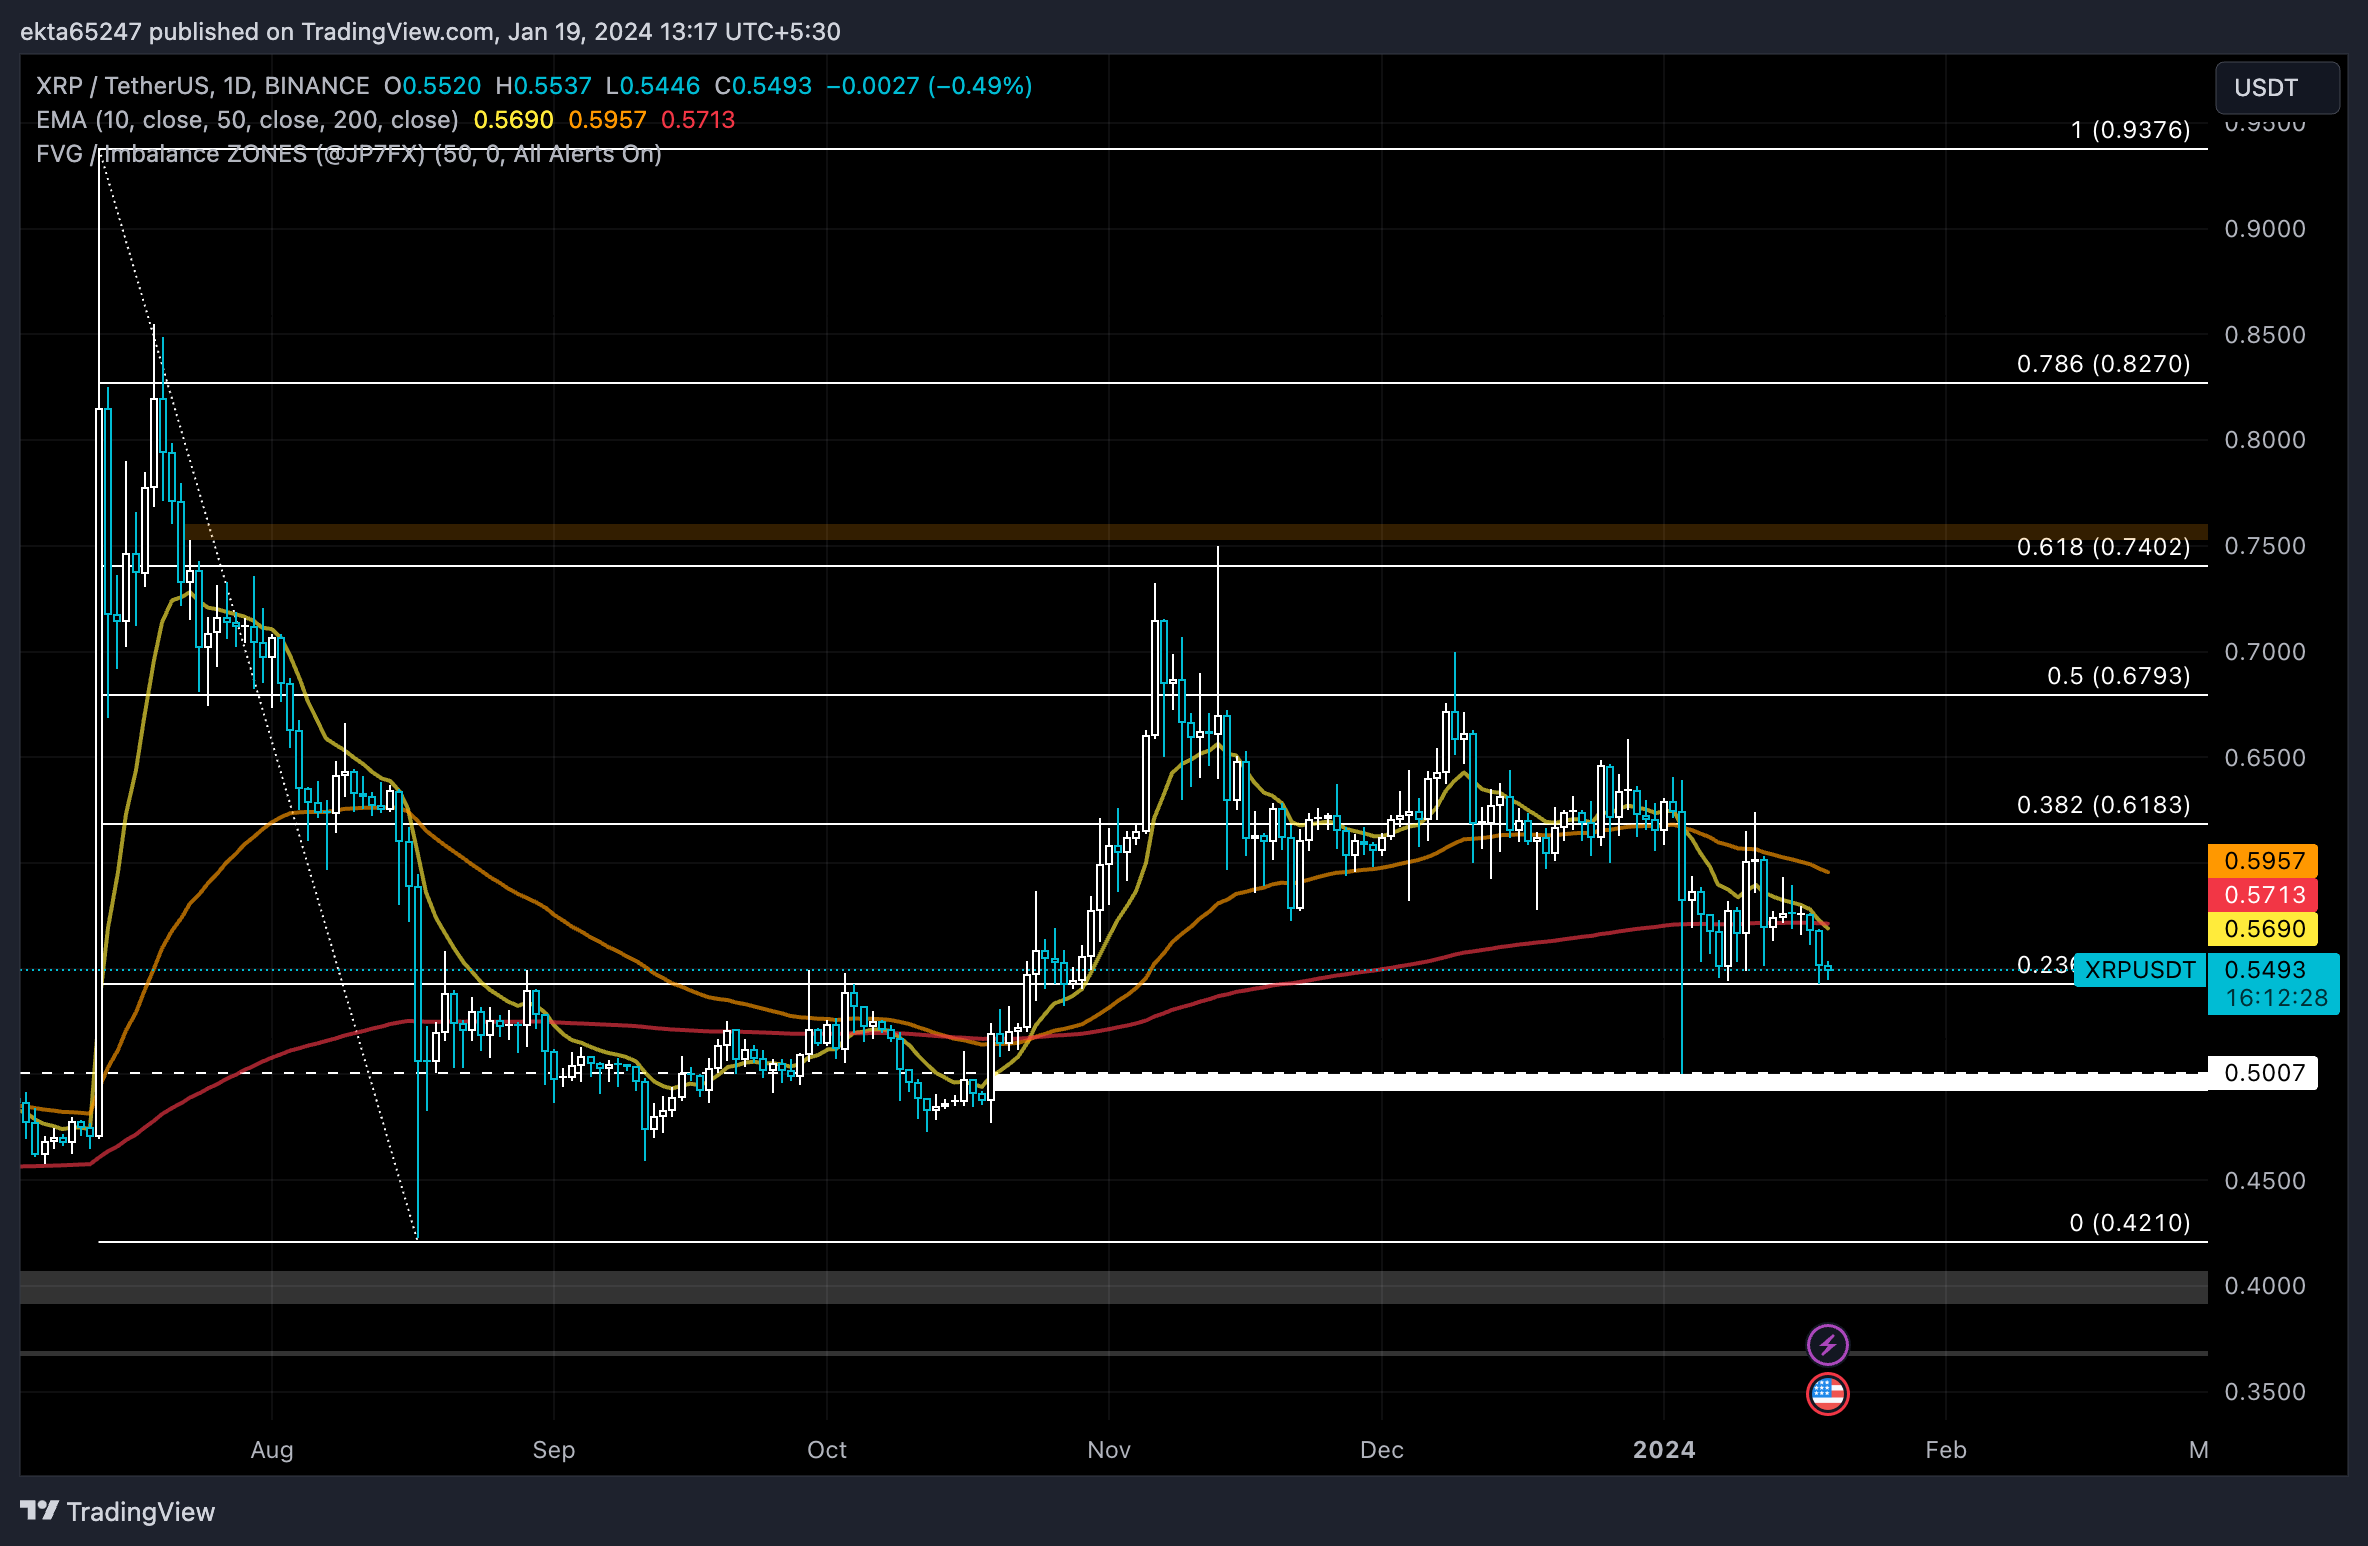
XRP/USDT 1-day chart
A daily candlestick close above the 10-day EMA at $0.5690 could invalidate the bearish thesis for XRP price.
Information on these pages contains forward-looking statements that involve risks and uncertainties. Markets and instruments profiled on this page are for informational purposes only and should not in any way come across as a recommendation to buy or sell in these assets. You should do your own thorough research before making any investment decisions. FXStreet does not in any way guarantee that this information is free from mistakes, errors, or material misstatements. It also does not guarantee that this information is of a timely nature. Investing in Open Markets involves a great deal of risk, including the loss of all or a portion of your investment, as well as emotional distress. All risks, losses and costs associated with investing, including total loss of principal, are your responsibility. The views and opinions expressed in this article are those of the authors and do not necessarily reflect the official policy or position of FXStreet nor its advertisers. The author will not be held responsible for information that is found at the end of links posted on this page.
If not otherwise explicitly mentioned in the body of the article, at the time of writing, the author has no position in any stock mentioned in this article and no business relationship with any company mentioned. The author has not received compensation for writing this article, other than from FXStreet.
FXStreet and the author do not provide personalized recommendations. The author makes no representations as to the accuracy, completeness, or suitability of this information. FXStreet and the author will not be liable for any errors, omissions or any losses, injuries or damages arising from this information and its display or use. Errors and omissions excepted.
The author and FXStreet are not registered investment advisors and nothing in this article is intended to be investment advice.
Recommended Content
Editors’ Picks

Ethereum Price Forecast: ETH ETFs post first weekly inflows since February
Ethereum ETFs recorded net inflows of $104.1 million on Friday — their highest daily inflow since February 4, per SoSoValue data. As a result, the products saw a weekly net inflow of $157.1 million, which also marks their highest net buying activity since February.

Defi Development Corporation files to offer $1 billion in securities to boost its Solana holdings
Defi Development Corporation filed a registration statement with the Securities & Exchange Commission on Friday, signaling its intent to offer and sell a wide range of securities.

Bitwise hints at NEAR ETF following Delaware registration
The filing marks a crucial step before a firm submits an application for an ETF with the SEC. While Bitwise has not yet applied for a NEAR ETF with the SEC, similar actions preceded its previous XRP and Aptos ETF filings.

Bitcoin price could reach $285K by 2030 as Citigroup forecasts $1.6 trillion stablecoin inflows
Bitcoin price outlook strengthens as Citigroup projects $1.6 trillion stablecoin growth, calling them critical bridges between banks and blockchain.

Bitcoin Weekly Forecast: BTC consolidates after posting over 10% weekly surge
Bitcoin (BTC) price is consolidating around $94,000 at the time of writing on Friday, holding onto the recent 10% increase seen earlier this week.

The Best brokers to trade EUR/USD
SPONSORED Discover the top brokers for trading EUR/USD in 2025. Our list features brokers with competitive spreads, fast execution, and powerful platforms. Whether you're a beginner or an expert, find the right partner to navigate the dynamic Forex market.