XLM Price Prediction: XLM poised for massive 27% breakdown, as the technical picture worsens
- Stellar is on the verge of a breakdown toward $0.3 if the triangle's x-axis gives in to the bearish pressure.
- Selling pressure continues to mount, especially with the MACD diving below the midline.
- Recovery will come into the picture if XLM reclaims the ground above the x-axis.

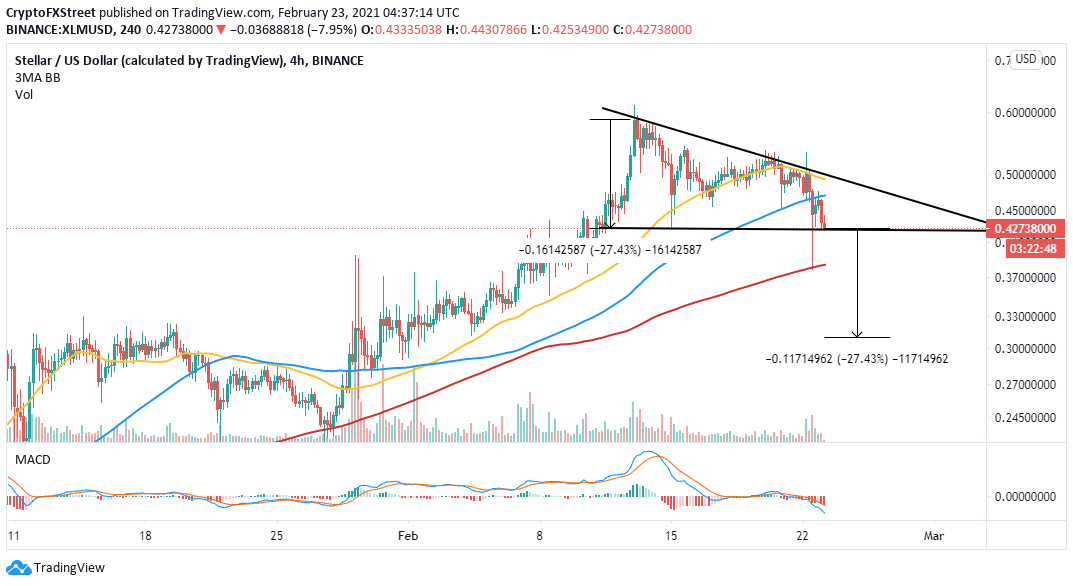
Stellar has recently been rejected from the yearly high of $0.61. Bulls tried their best to secure higher support but failed in that task. XLM continues with the breakdown below a descending trendline that seems to have confirmed a triangle pattern on the 4-hour chart. Meanwhile, Stellar's technical picture appears to be worsening, hinting at a continued breakdown.
Stellar's downside eyes $0.3
From a short-term technical perspective, XLM is poised for another downswing. For instance, the descending triangle pattern on the 4-hour chart is a bearish signal. The pattern is created by connecting a series of peaks with a trendline while a horizontal line links the asset's lows.
A break under the triangle's x-axis results in a breakdown equal to the distance between the triangle's highest and lowest points. Notably, the drop is usually rapid and must be timed correctly to make the most out of it. However, traders must be careful to avoid false breakdowns by waiting for confirmation.
XLM/USD 4-hour chart
The same 4-hour chart highlights a bearish Moving Average Convergence Divergence (MACD). In addition to falling into the negative region, the MACD line (blue) increases the divergence below the signal line. In other words, selling pressure is likely to continue rising, adding credence to the expected breakdown.
Looking at the other side of the fence
The 200 Simple Moving Average (SMA) on the 4-hour chart might support $0.38 and prevent losses from extending to $0.3. On the upside, recovery may come into the picture immediately if XLM reclaims its position within the triangle. The 100 SMA and 50 SMA are expected to delay recovery, but a break out past the trendline will lift Stellar to higher levels.
Author

John Isige
FXStreet
John Isige is a seasoned cryptocurrency journalist and markets analyst committed to delivering high-quality, actionable insights tailored to traders, investors, and crypto enthusiasts. He enjoys deep dives into emerging Web3 tren


