XLM Price Prediction: Stellar edges closer to 20% breakout
- XLM price has been trading sideways in a flat channel for more than a month.
- A move beyond the setup’s upper trend line forecasts a 20% bull rally to $0.52.
- Stelar could slide 11% to $0.31 if the technical formation’s lower boundary is broken down.

The XLM price hints at an upswing as it trades around a crucial support level.
XLM price eyes reversal
The XLM price has formed three swing highs that have tapped the resistance at $0.43 since February 23. Similarly, three swing lows formed during the same period saw a bounce from the $0.33 support barrier.
A flat channel seems to form by connecting the swing highs and lows using trendlines. This setup forecasts a 20% upswing to $0.52 if the upper trend line at $0.43 is breached.
The most recent attempt was rejected by the upper boundary and is currently trading around the flat channel’s middle line at $0.39. A bounce from this point seems likely due to the recently spawned buy signal from the SuperTrend indicator.
Hence, a bounce from the middle line at $0.39 or the immediate support at $0.38 could propel XLM price to the upper boundary. A spike in bullish momentum here leading to a decisive close above $0.43 on the 12-hour chart will confirm a bullish breakout.
In such a case, Stellar is likely to surge 20% to hit the intended target at $0.52.
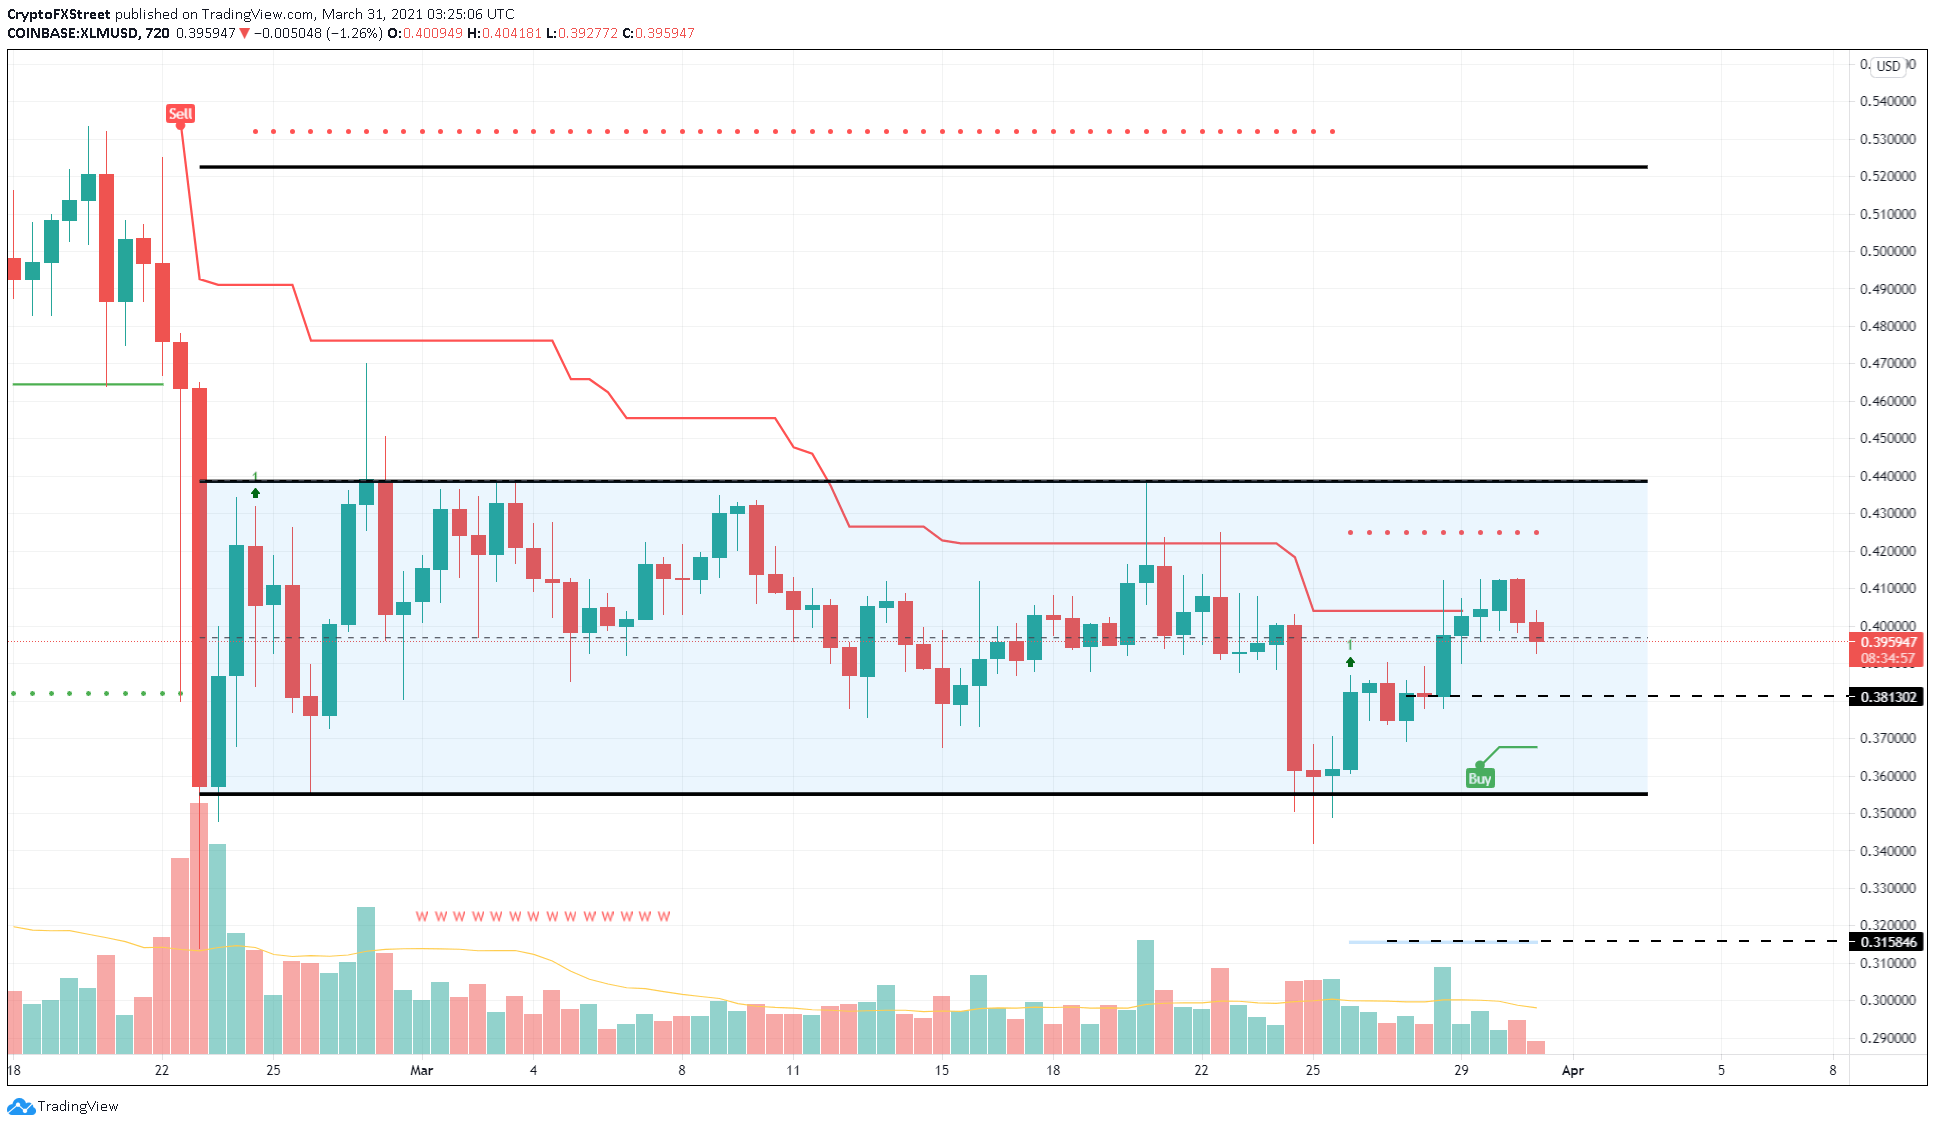
XLM/USD 12-hour chart
Adding credence to the bullish outlook is the low social volume, which can be perceived as a bullish sign from a counter-sentiment perspective. A spike in price followed by a sudden uptick in social volumes tends to mark cycle tops more often than not.
Therefore, a low social volume creates a perfect scenario for a surge in the Stellar price.
%20[09.43.18,%2031%20Mar,%202021]-637527608341748002.png)
Stellar Social Volume chart
A sell-off up to the lower boundary at $0.35 is likely and plausible. However, if the XLM price convincingly slides below this level, the bullish thesis will be in trouble. A decisive close below $0.33 will invalidate the positive outlook and trigger a sell-off to the immediate support at $0.31.
Author

Akash Girimath
FXStreet
Akash Girimath is a Mechanical Engineer interested in the chaos of the financial markets. Trying to make sense of this convoluted yet fascinating space, he switched his engineering job to become a crypto reporter and analyst.


