Stellar Price Prediction: XLM bullish outlook affirmed last week
- Stellar price closed Sunday with a weekly hammer pattern.
- Long-term moving averages on the daily chart remain in uptrends.
- XLM primed to rise 25% in the coming days.

Stellar price has trended sideways for 33 days between $0.440 and $0.350, and on below-average volume on each day. The 8.5% decline on March 24 was exhausted by the 25th, and XLM closed with a hammer pattern on the weekly chart, putting traders on alert that bulls were back in control. Price has since rebounded to the middle of the channel at $0.395.
Stellar price/volume profile points to accumulation
The cryptocurrency complex experienced increased volatility last week, led by Bitcoin, the bellwether cryptocurrency, but XLM closed the week down only -1.55%. The quick reversal was evidence that shakeouts to or around the low of the channel are being used as accumulation pivots.
Moving forward, XLM needs to close above the high of the Hammer at $0.425 to confirm the reversal. The $0.425 price level corresponds very closely with the 50-day simple moving average (SMA). A breakout from this price level will put the channel resistance at $0.440 in play.
A breakout from the channel presents a price vacuum to the 3.618 Fibonacci extension of the May 19-May 2020 bear market at $0.555, a gain of over 25%.
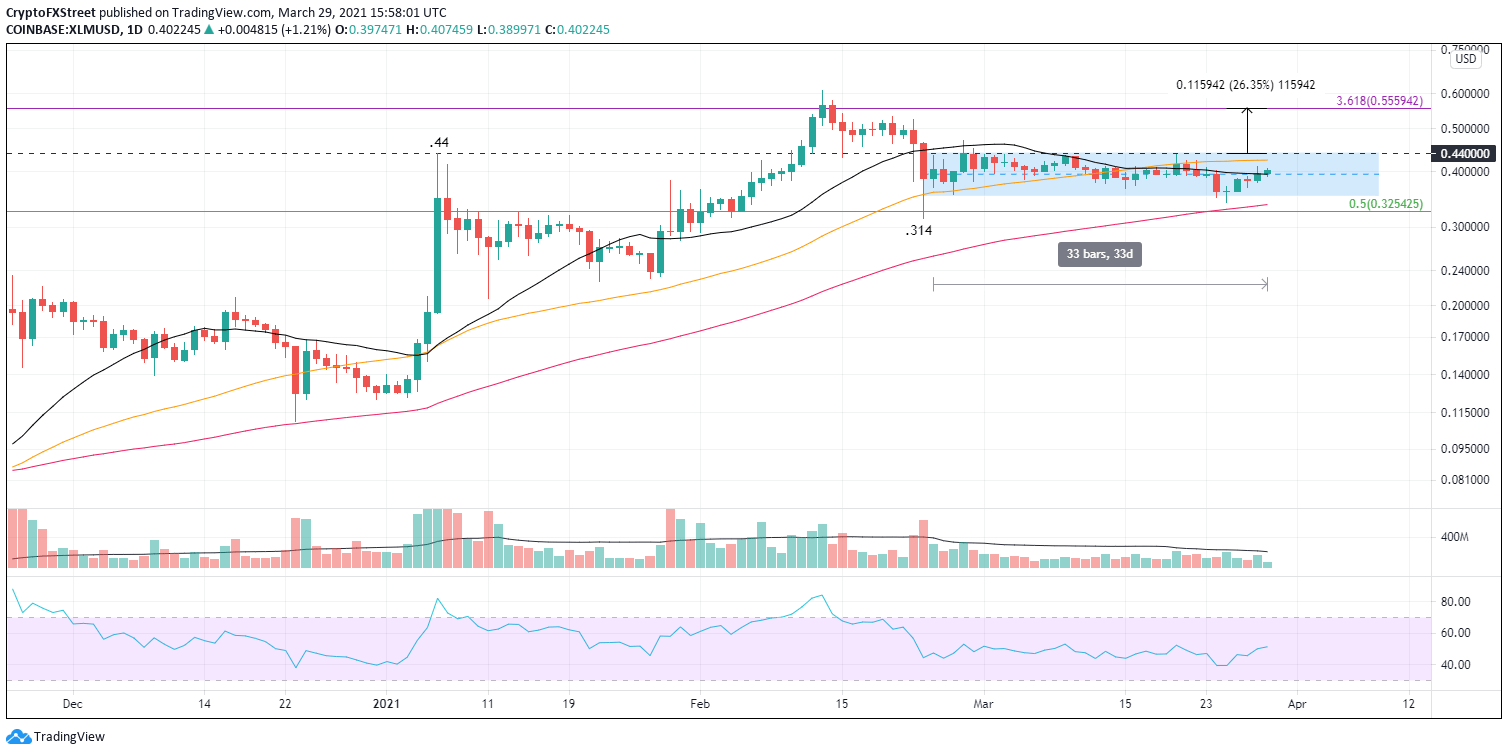
XLM/USD daily chart
Stellar price support begins at $0.350, followed by the 100-day SMA at $0.338, and then the February low at $0.314. If none of the levels halt price weakness, XLM is exposed to a more significant decline, taking the altcoin to the January lows around $0.230.
Author

Sheldon McIntyre, CMT
Independent Analyst
Sheldon has 24 years of investment experience holding various positions in companies based in the United States and Chile. His core competencies include BRIC and G-10 equity markets, swing and position trading and technical analysis.


