XLM price hints at bullish breakout toward $0.48
- XLM price is presently developing a powerful bullish breakout pattern on its $0.005/3-box Point and Figure chart.
- XLM is one of the best-positioned cryptocurrencies to benefit from any rally.
- A sustained and robust uptrend could be right around the corner.

XLM price continues to lag in overall performance against not just its peers, the broader cryptocurrency market as a whole. However, that may change as XLM develops a powerful bullish continuation setup on its Point and Figure chart.
XLM price poised to gain +44% with a bullish target at $0.485
XLM price on the $0.005/3-box Point and Figure chart is developing one of the most bullish breakout entry conditions it has had since March 2021. In Point and Figure analysis, a chart is always in a bull market or bear market depending on where it is in relation to the dominant trendline. XLM broke above the red bear market trendline in early October, converting it into a bull market.
The resulting XLM price action has created conditions for one of the most sought-after bullish entry patterns, the Split Triple-Top. The Split Triple-Top is confirmed if new X-column forms and XLM returns to $0.365. The entry is one box above at $0.37. Utilizing the vertical profit target method in Point and Figure from the last strong X-column projects the potential target zone at $0.48.
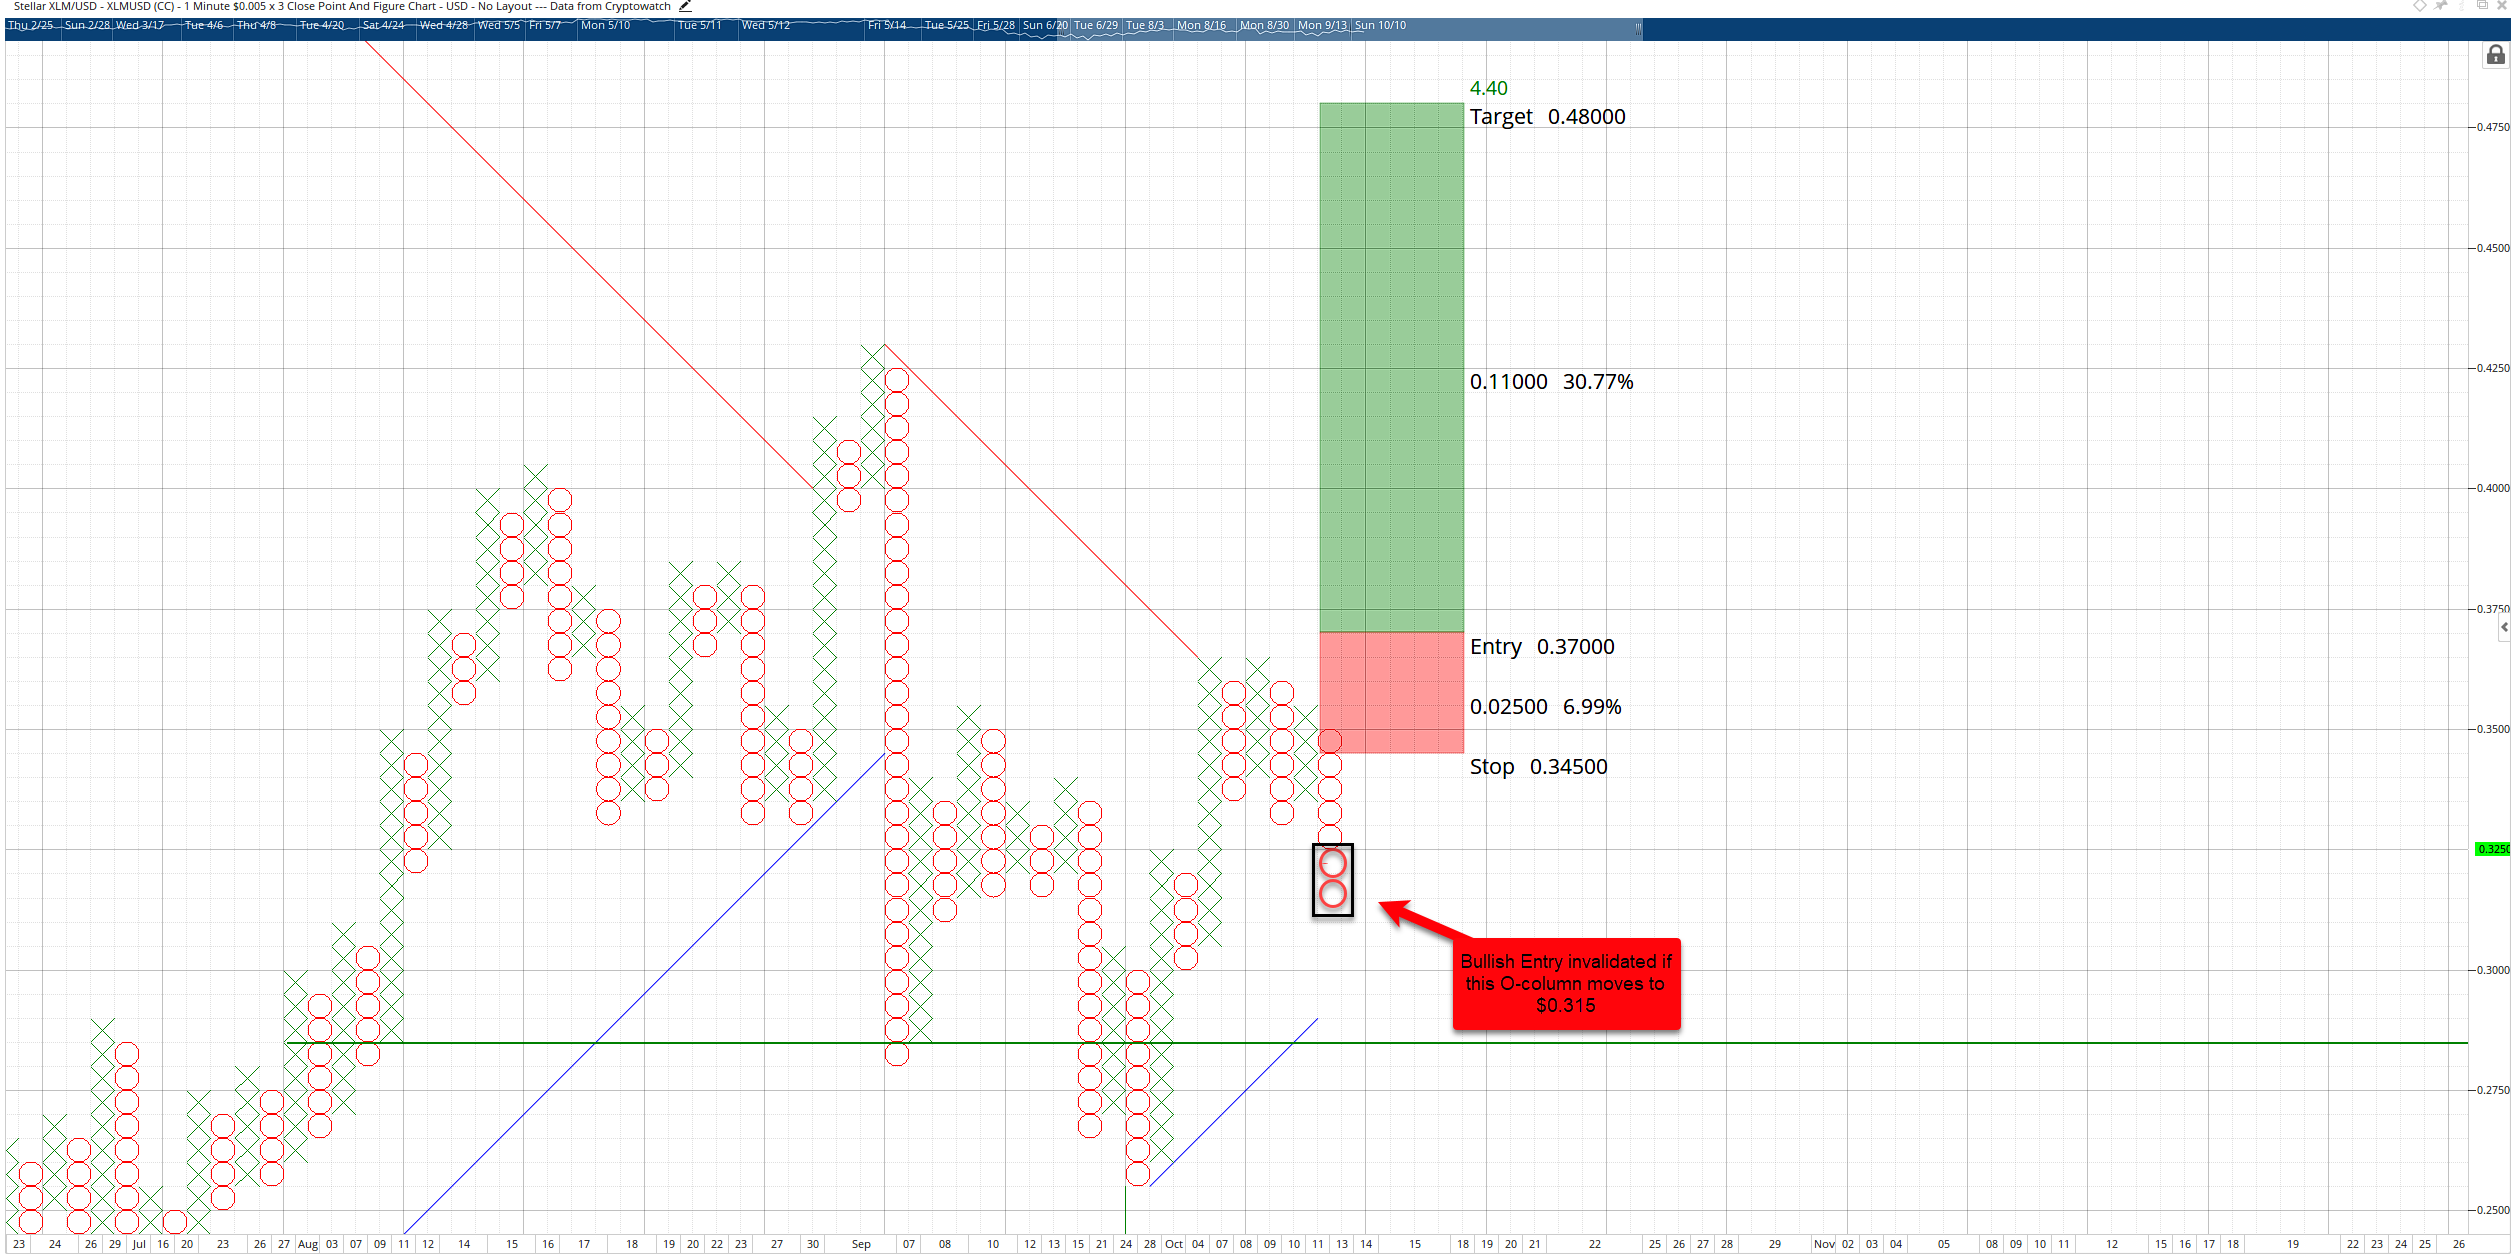
XLM/USD $0.005/3-box reversal Point and Figure Chart
However, the bullish entry and outlook will be invalidated if the current O-column moves lower to $0.315. In that scenario, XLM would remain in the technical bull-market on this Point and Figure chart, but it would signal weakness. The perceived weakness is because the first pullback after breaking a dominant trend angle should be a solid responsive move in the direction of the break. Thus, a move lower would likely indicate sellers regaining control.
Author

Jonathan Morgan
Independent Analyst
Jonathan has been working as an Independent future, forex, and cryptocurrency trader and analyst for 8 years. He also has been writing for the past 5 years.


