XLM price looks ready to fall to $0.20
- XLM price has not retested any strong Fibonacci levels.
- Stellar Lumens price is forming a double top on the RSI.
- Invalidation for the bearish model is a close above $0.24.

XLM price is showing more bearish signals. Early buyers should be careful as price action may begin plummeting in the days to come.
XLM price spells trouble
XLM price has been one of the more concerning digital assets lately. Mid-March documented that the Stellar Lumens price would likely stall in the $0.22 range. The bears established RSI divergence on the 12-hour chart to close the month. The two-day chart shows similar signs of a weakness in the current uptrend.
Stellar Lumens price is currently trading at $0.22, printing lower highs progressively on the 2-day chart. XLM shows a double top resistance pattern on the Relative Strength Index. The pattern is established strictly at the sellers’ notorious 60 level, a level likely to scare professional traders away from scalps or uptrend fades.
XLM price still has not retested any strong Fibonacci levels. Due to the amount of chop in the $0.22 zone, traders are probably waiting for the 38.2% Fib level at $0.20 to interact with the Stellar Lumens price before making any long-term decisions.
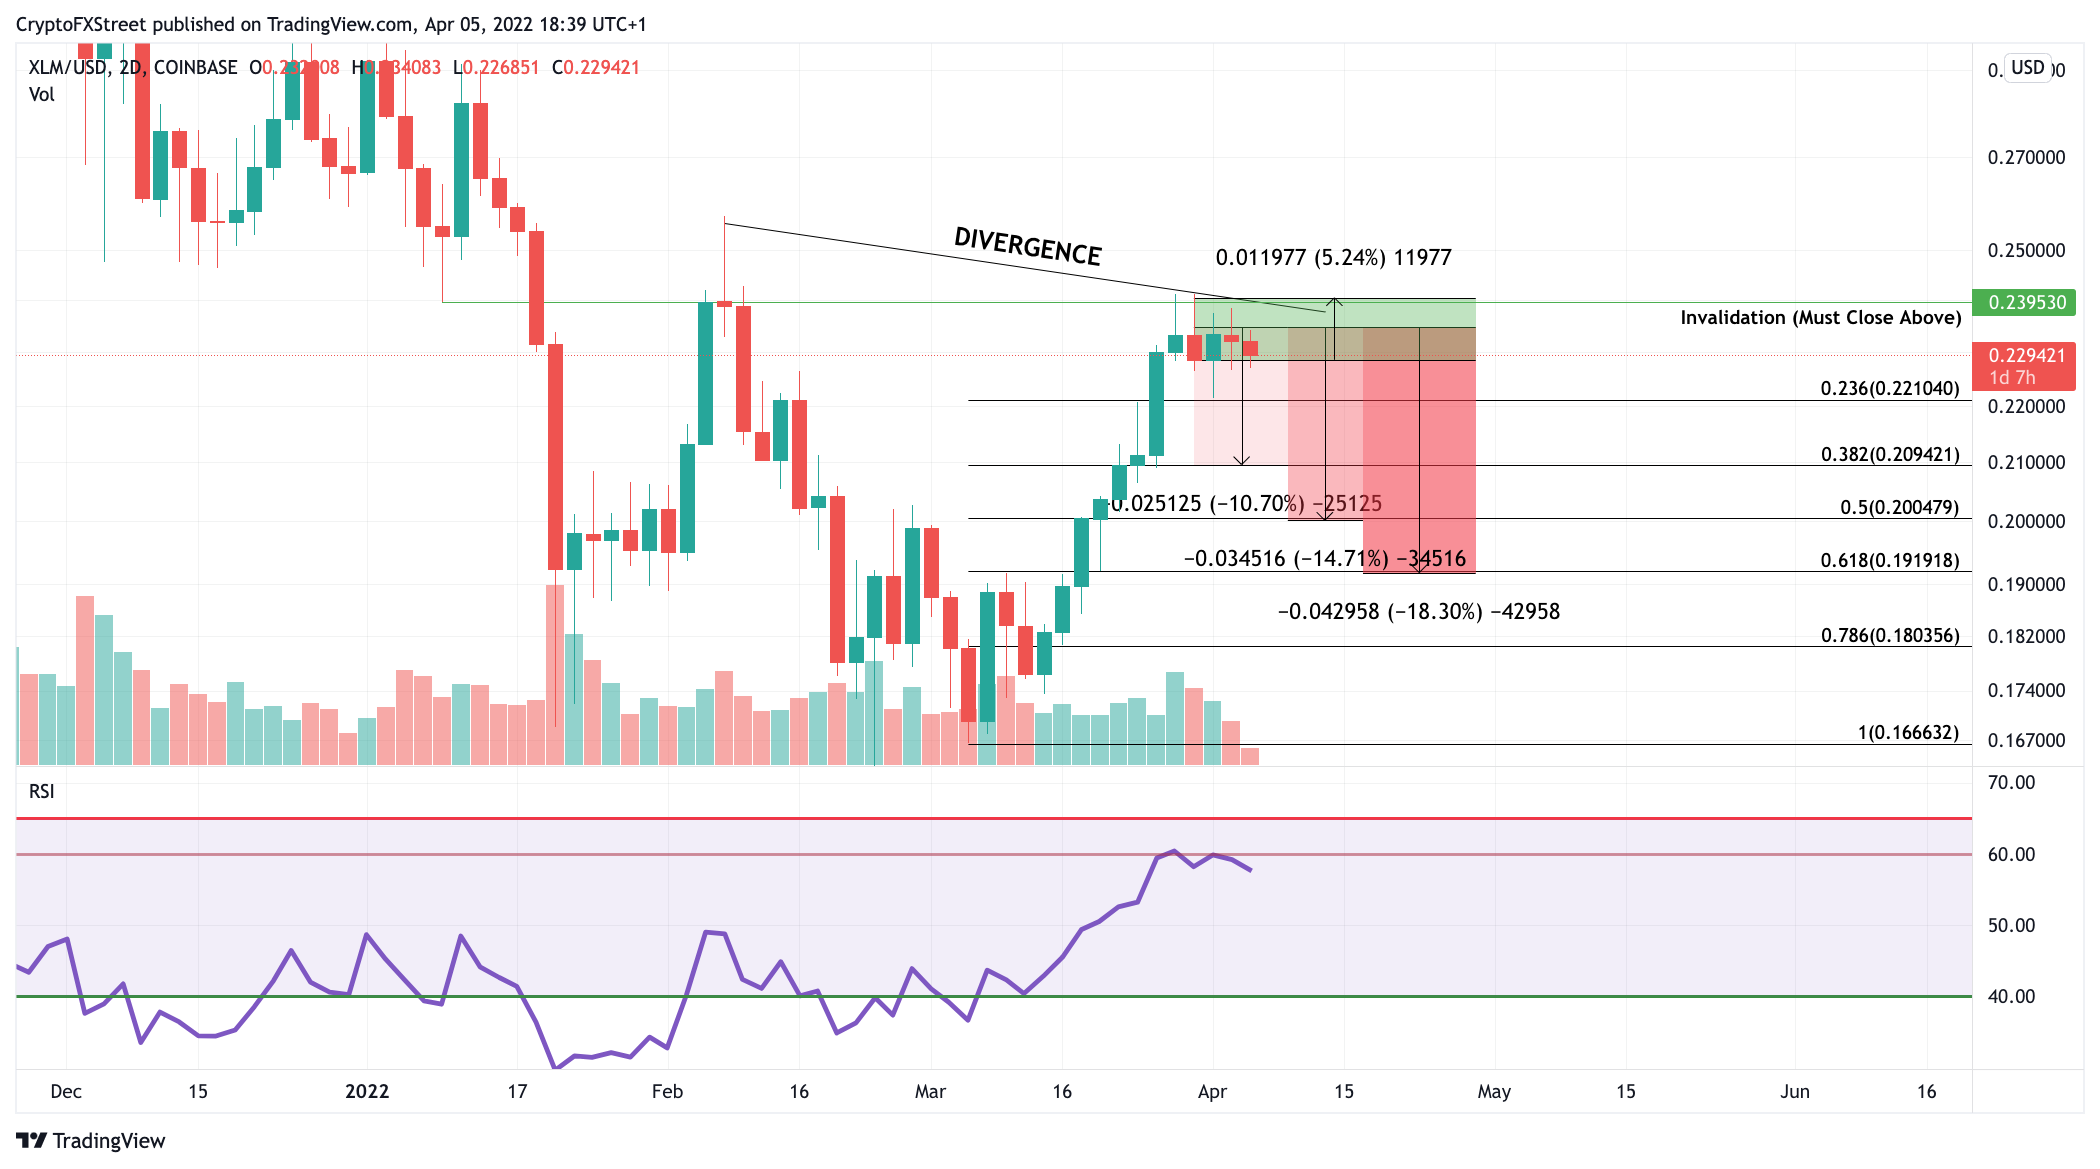
XLM/USD 2-Day Chart
The bearish model can be invalid if the bulls can print a close above the $0.24 on the 2-day chart. If this were to occur, the XLM price could continue soaring towards order blocks at $0.26 and even $0.29, resulting in up to a 30% increase from the current levels.
Author
FXStreet Team
FXStreet
Composed of a group of economic journalists and FX experts, the FXStreet content team produces and oversees all content published on FXStreet. It provides a purely journalistic approach to the Forex market.


