XLM price crawls steadily higher, targets $0.35
- XLM price slowly trudges higher, creating new higher closes.
- The slow and persistent move higher is a sign of strength, limiting volatile whipsaws.
- A major pullback is increasingly unlikely.

XLM price has maintained a steady drive higher, but has settled into a consolidation phase. As a result, the bodies of the daily candlesticks have been mostly contained between the $0.23 to $0.24 value areas.
XLM price action closes in a breakout return to $0.35
XLM price action has remained very stable and controlled compared to its peers. One of the clearest examples of this stability is the proximity of the bodies of the daily candlesticks to the Tenkan-Sen. There have been few major deviations away from the Tenkan-Sen in the past thirty days.
When price action and the Tenkan-Sen follow each other closely – almost as if holding hands – it is a sign of strength and not something to trade against. This behavior within the Ichimoku system can last for a prolonged period of time before a major move puts price out of equilibrium with the Tenkan-Sen. That may soon change.
An important warning sign that a significant rally is soon to begin can be observed between the Composite Index and the Relative Strength Index. The Relative Strength Index has a series of higher lows, while the Composite Index has lower lows. That discrepancy is known as hidden bullish divergence – an alert that a bullish expansion phase is about to begin.
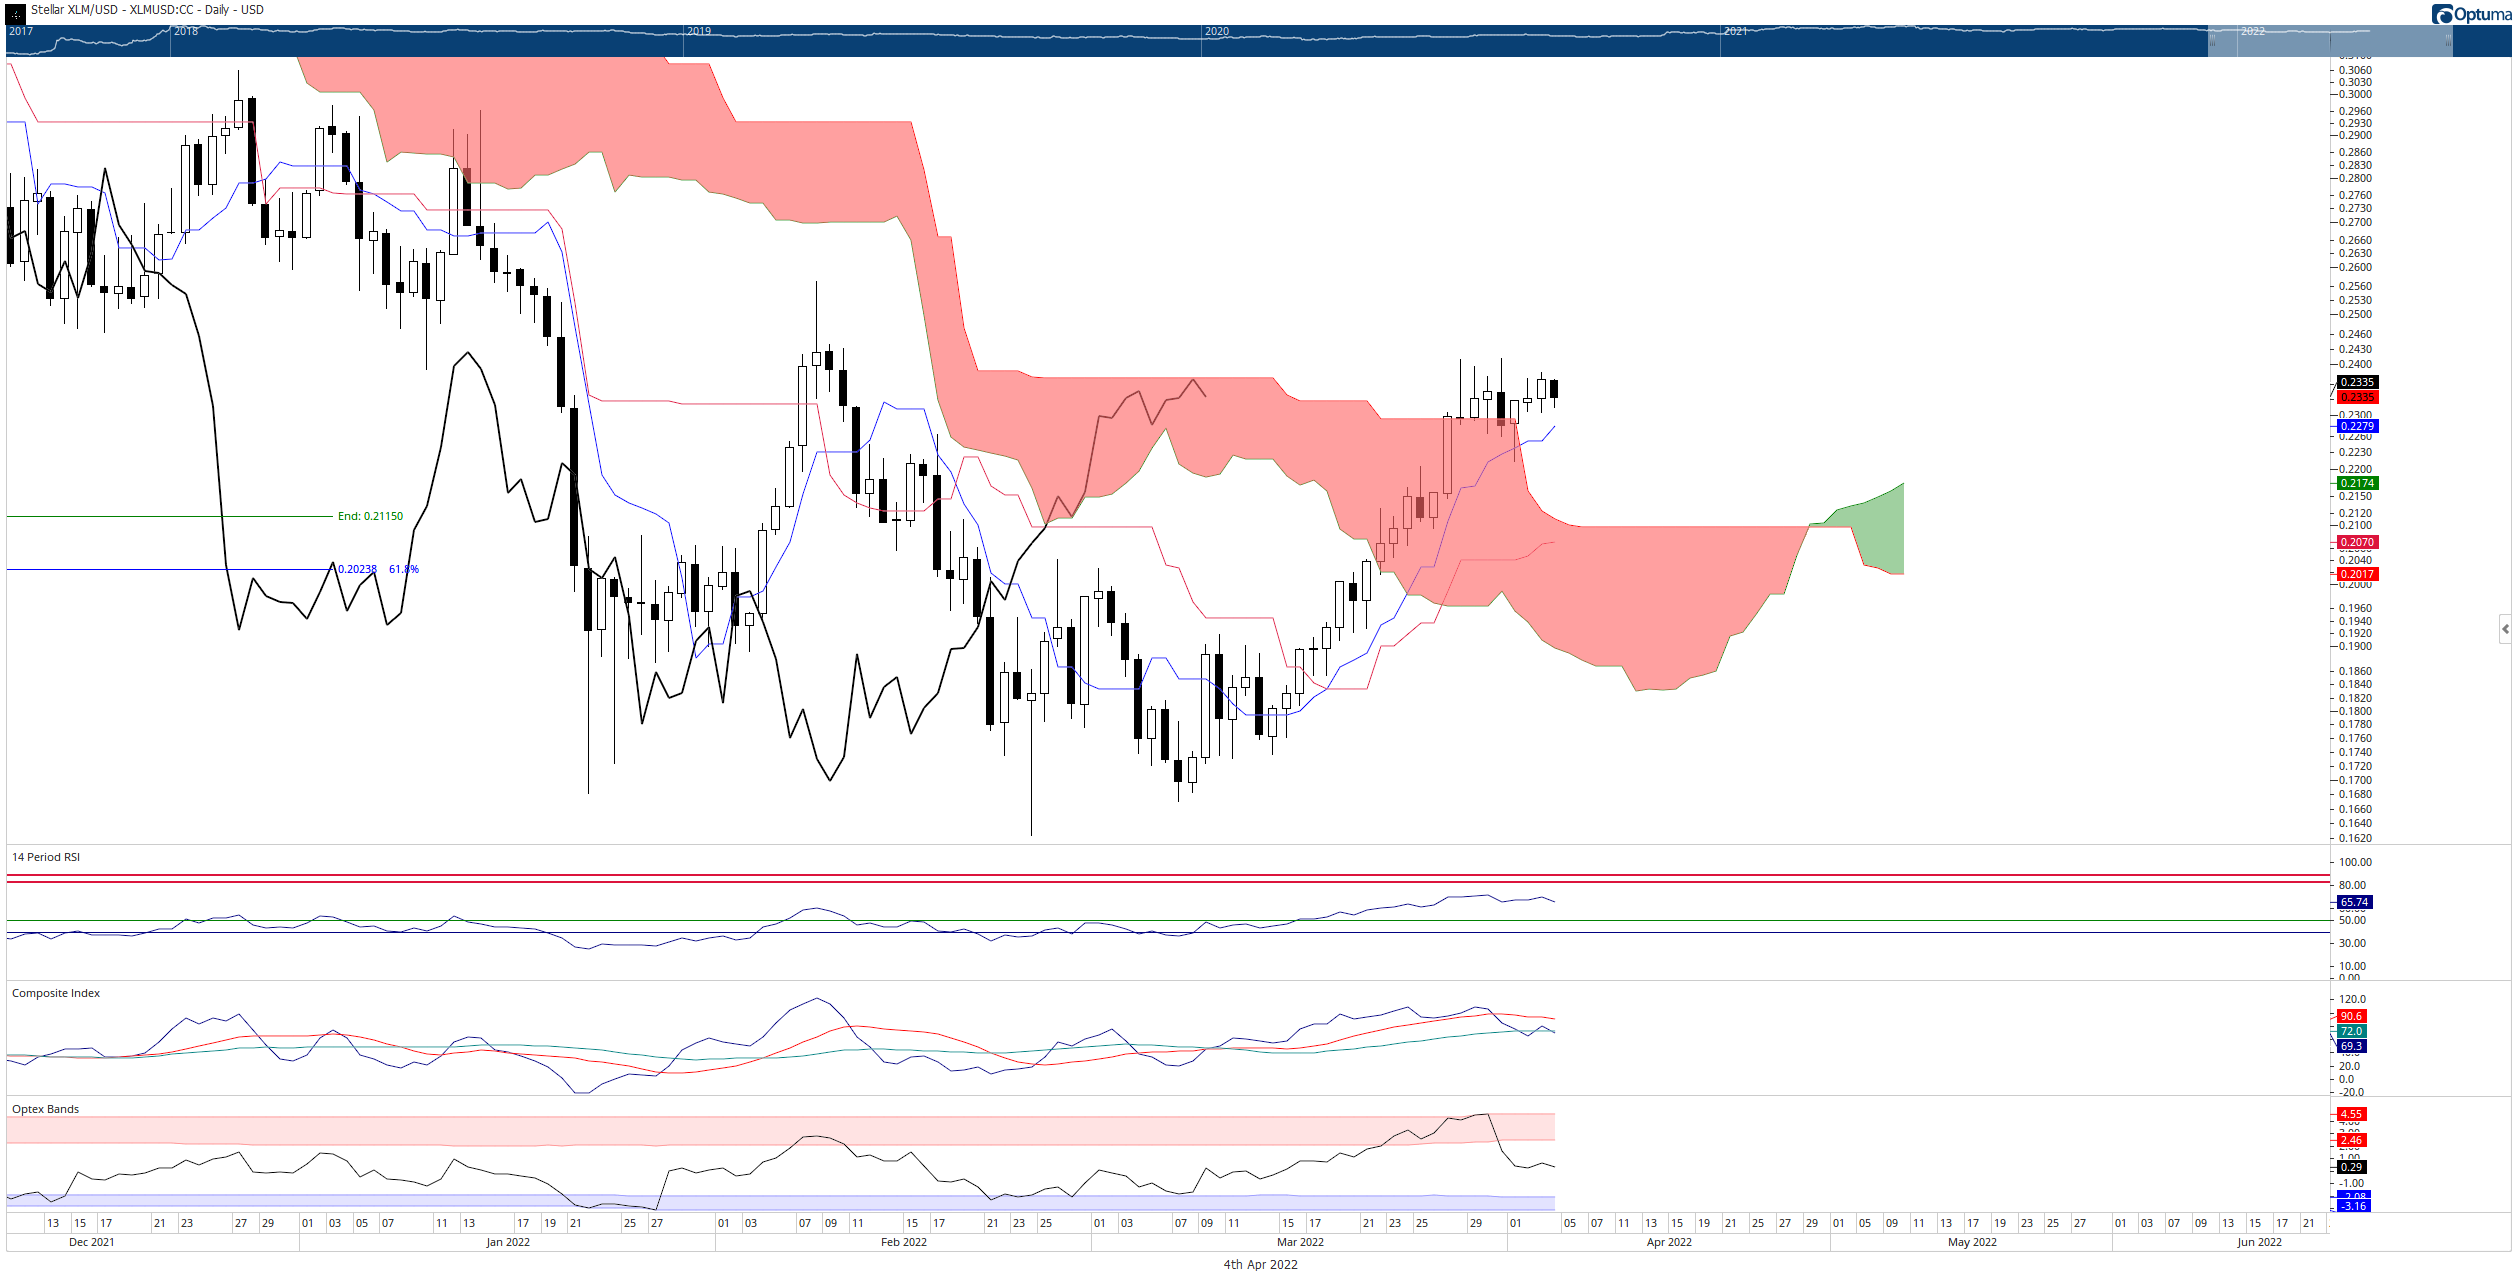
XLM/USD Daily Ichimoku Kinko Hyo Chart
Another impending bullish condition is the Chikou Span closing above the Ichimoku Cloud. This is often a major trigger for prolonged uptrends – and XLM price, more than many other major cryptocurrencies, maybe one of the biggest performers in the next bull phase. Why?
Don’t forget: While most of the cryptocurrency market has made new all-time highs, XLM price has not made a new all-time high since January 2018.
Author

Jonathan Morgan
Independent Analyst
Jonathan has been working as an Independent future, forex, and cryptocurrency trader and analyst for 8 years. He also has been writing for the past 5 years.




