XLM Price Forecast: Stellar anxiety dissipates before a 30% decline
- XLM price recovering from overnight lows, but the rebound is deceptive.
- Daily Relative Strength Index (RSI) is far from an oversold reading.
- 21Shares has expanded its roster of crypto ETPs with the launch of Stellar XLM ETP.

XLM price busted the neckline of a head-and-shoulders top pattern yesterday and quickly plunged below the 100-day simple moving average (SMA) before gaining price traction and propelling higher. However, the rebound has not changed the bearish outlook first highlighted in an April 20 FXStreet article.
XLM price trying to shake the grip of bearish historical precedent
The last three corrections have averaged around 50%, and two of the three were short, lasting four and nine days, respectively. As the Stellar head-and-shoulders top is constructed, it forecasts a loss of just over 50% from the April 13 high.
A decline of the magnitude mentioned above would drive the daily RSI below 30, announcing a momentum low for the decline and the technical basis for a new, long-term rally. Without it, Stellar will be challenged to complete a recovery to new highs.
In the path of the head-and-shoulders measured move target of $0.304 is the 100-day SMA at $0.417, the overnight low at $0.390, and the rising trendline from the February 22 low at $0.372. The measured move target also includes an undercut of the February low at $0.314.
To reiterate, at the measured move target, Stellar will be down over 30% from the current price, 34% from the neckline break, and 55% from the April 13 high. Moreover, if the February low is shattered, it will break the series of higher lows for corrections and thrust bullish Stellar speculators into a long waiting game.
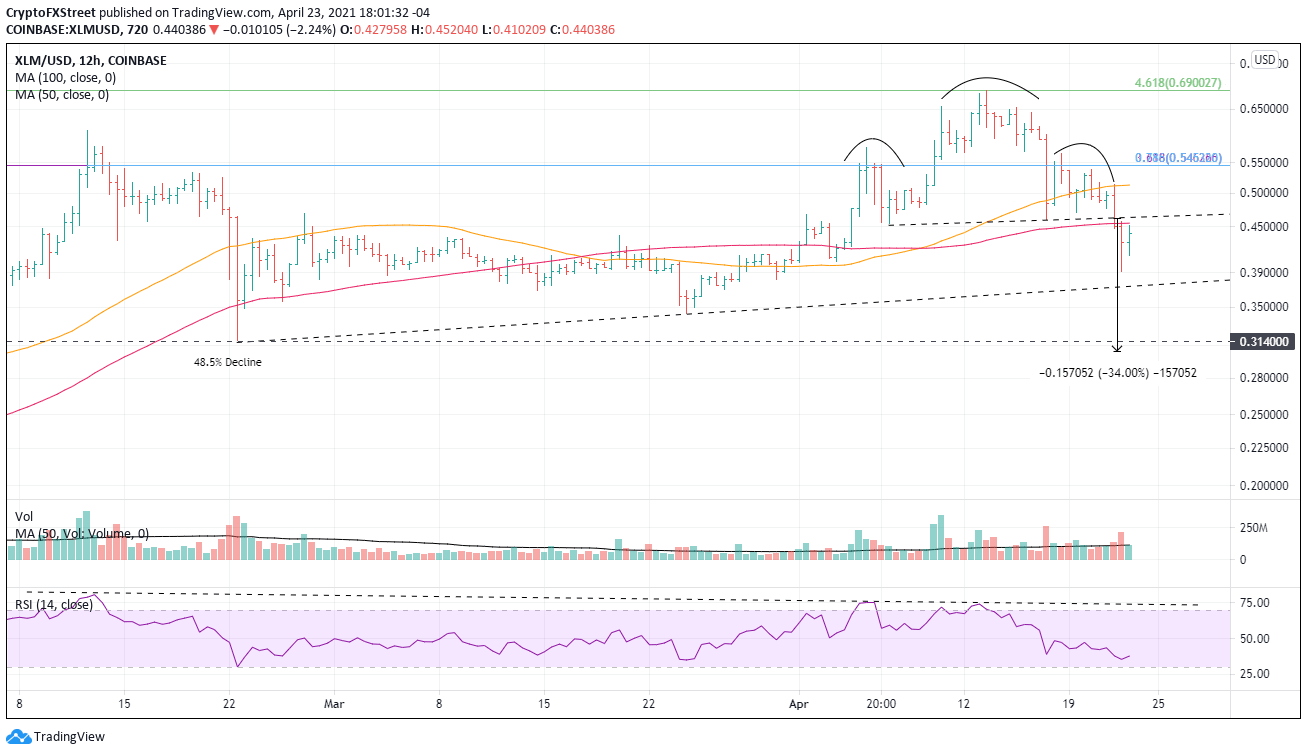
XLM/USD 12-hour chart
If the Stellar rebound firms, the 100 12-hour simple moving average (SMA) at $0.455 will be the first line of resistance, closely followed by the neckline at $0.463. A daily close above the neckline would raise the odds of a test of the 50 12-hour SMA at $0.513, but the meeting of Fibonacci levels at $0.545 will prove to be a significant challenge.
Author

Sheldon McIntyre, CMT
Independent Analyst
Sheldon has 24 years of investment experience holding various positions in companies based in the United States and Chile. His core competencies include BRIC and G-10 equity markets, swing and position trading and technical analysis.


