XLM price falls under weak support to $0.20
- Stellar price action is in a descending triangle pattern.
- Fibonacci retracement shows hidden resistance in favor of the bears.
- A break of $0.26 could open Pandora’s Box with a 23% downturn to follow.

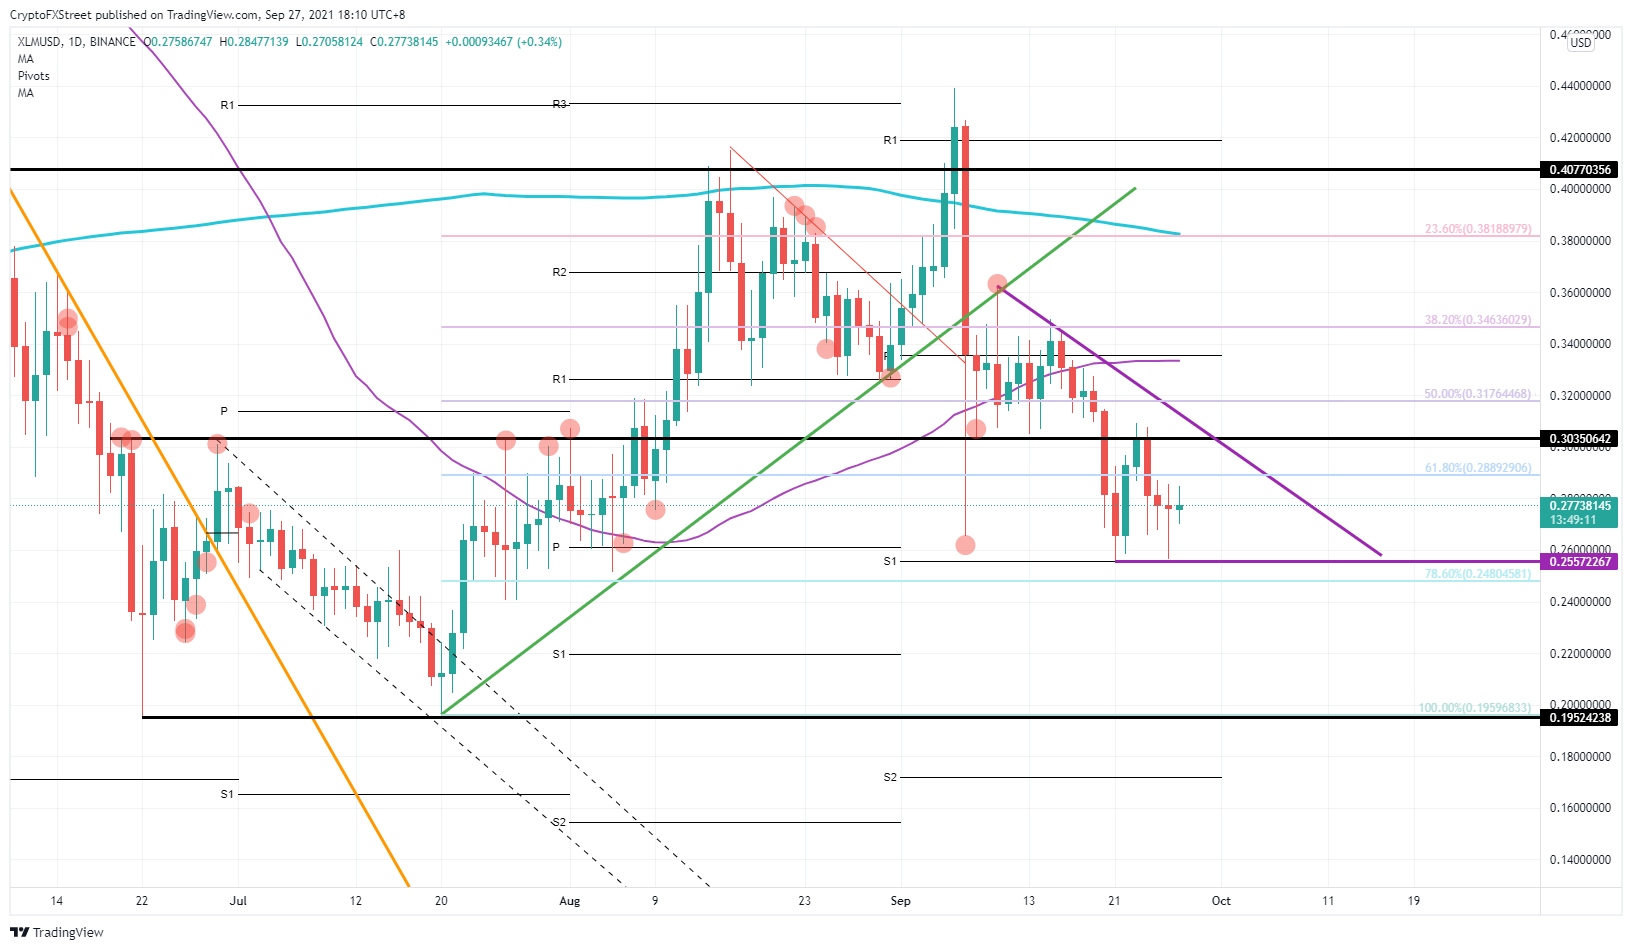
Stellar price action (XLM) has been in a descending triangle for most of September. Bears are enjoying the respected technical levels that are showing resistance against bulls who are attempting to overhaul the downtrend. With these actions, sellers are getting even more powerful in terms of XLM price action. A break of the $0.26 level to the downside could open up even more losses for XLM price with a target of $0.20.
The monthly S1 is the only lifebuoy for bulls in XLM price action
Stellar price is in a downtrend and has been respecting the formation of a descending triangle since September 10. In the downturn, bulls have attempted to break out of the trend but failed each time miserably. The attempts each time bounced off either a significant historical level that was turned from support into resistance or got rejected at the Fibonacci retracement level from the low of July 20 to the high on September 6. In these attempts, sellers jumped on the occasion to match the buy volume and gain the ability to add even more short positions.
The best example in XLM price action was on September 23 and 24. Buyers tried to overcome $0.30, but price action in Stellar got pared by a massive bearish candle. With already two retests of $0.25, which falls in line with the S1 monthly support level, the triangle's base got formed. Expect price action in Stellar to move back toward that monthly S1 for a third retest and a possible break to the downside.
XLM/USD daily chart
Once broken, expect some hesitation around the 78.6% Fibonacci level, just below $0.25. With already a few tests and a break on July 25 though, expect bears to push through this level quickly and go in a matter of weeks toward $0.20 as no absolute levels are in the way for any support.
If bulls can still hold the $0.25 region, expect a rebound of that level, with bulls again trying to break the downtrend. That would mean a retest of the purple descending trend line. With that trend line having few tests, a break would be difficult on the next attempt.
Like this article? Help us with some feedback by answering this survey:
Author

Filip Lagaart
FXStreet
Filip Lagaart is a former sales/trader with over 15 years of financial markets expertise under its belt.


