Will Ethereum price rally to $3,700? These whales believe so
- Ethereum price hints at a bullish move to $3,700 in two scenarios.
- Investors can expect this uptrend to occur if the $3,129 hurdle can be flipped into support.
- A daily candlestick close below $2,439, however, will invalidate the bullish thesis for ETH
Ethereum price recovery after the recent stint indicates that the bulls are back in business. The technicals and on-chain metrics have aligned and are signaling a recovery rally soon.
Ethereum price ready for a u-turn
Ethereum price action since September 19, 2021, could be read as developing a massive triple bottom setup. At the time, ETH created a swing low at $2,652 after a 34% crash. This downswing was followed by an 83% upswing in under two months to set an all-time high of $4,868.
Eventually, the market structure of cryptocurrencies deteriorated, leading to profit-taking that caused Ethereum price to crash 55% and deviate below the September 19, 2021, swing low at $2,652.
From a one-day time frame perspective, these two swing lows hint at a potential triple bottom setup.
A retest of the $2,652 support level again will complete this bottom reversal pattern and kick-start a massive run-up to the all-time high at $4,868. However, this move is yet to be confirmed and so, investors need to keep this in the back of their minds.
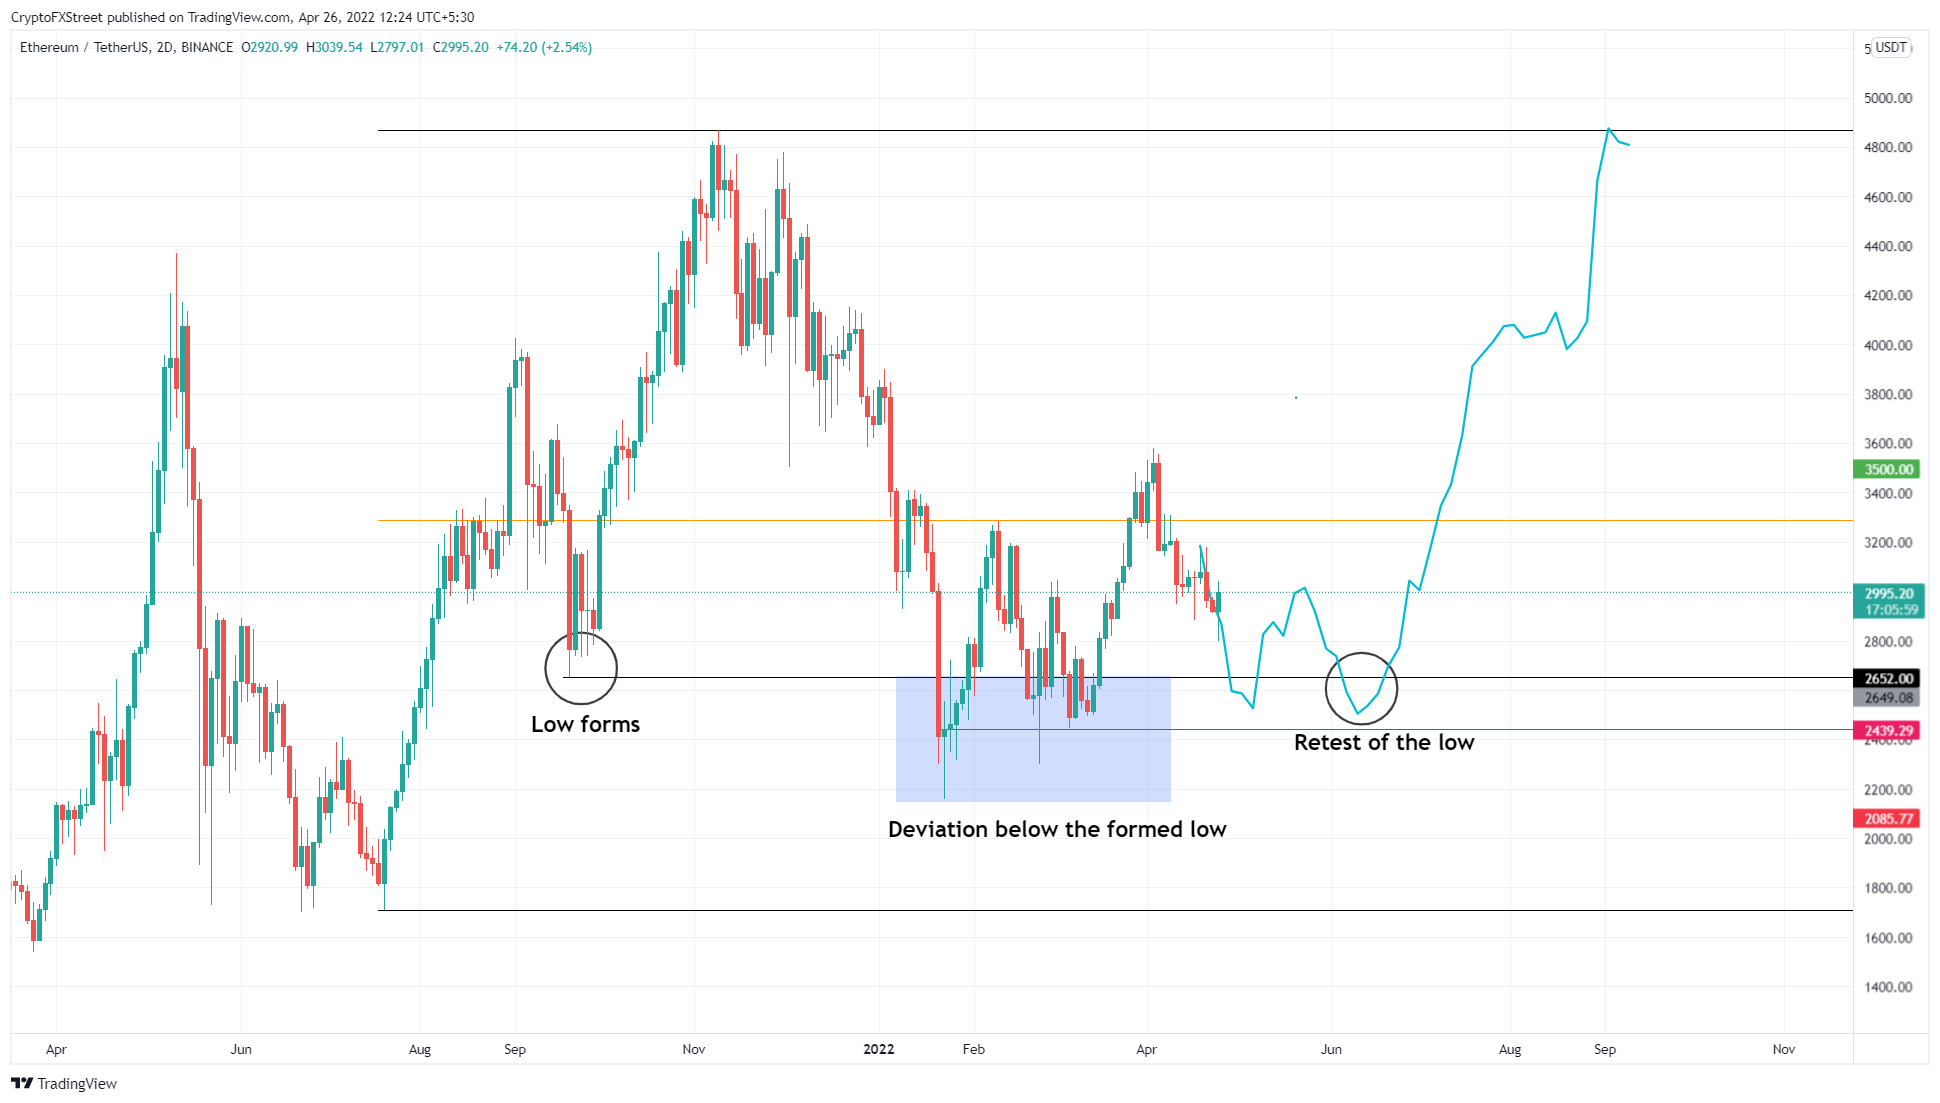
ETH/USDT 1-day chart
A more realistic outlook on how things will play out for Ethereum price is a bounce off the $2,800 to $3,000 support cluster followed by a decisive move above the 50-day SMA at $3,035 and the 2022 volume point of control at $3,129.
Producing a daily candlestick close above the aforementioned resistance levels will reveal the bulls’ strength and intentions to push higher. In such a case, ETH could rally 12% to retest the 200-day SMA at $3,476.
It is worth noting that ETH price might extend higher and fill the low-volume node at $3,703, bringing the total run-up to 25% from the current position at $2,990. Although unlikely, a retest of $4,000 could form a local top for Ethereum price.
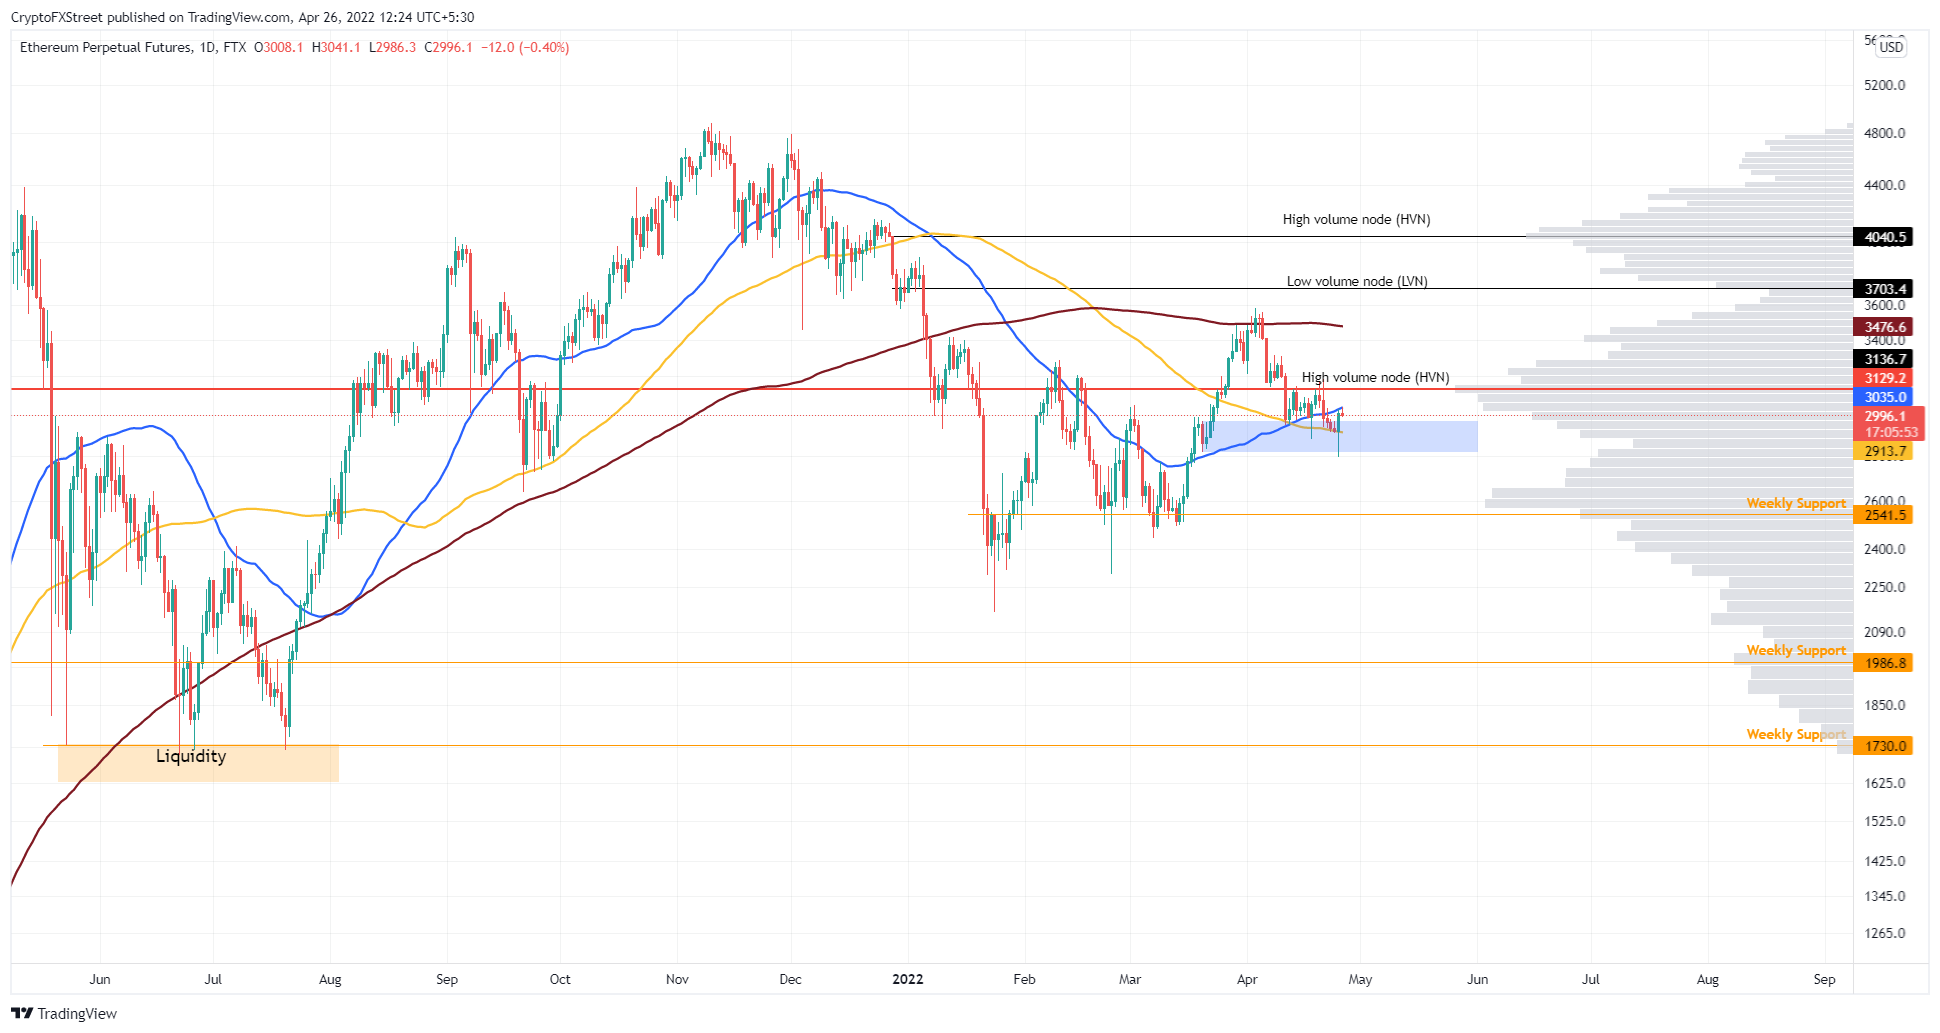
ETH/USDT 1-day chart
The bullish outlook is supported by the accumulation trend of whales holding between 10,000 to 100,000 ETH. This category of investors has historically bought the dips, which have resulted in massive returns.
For instance, these wallets increased their holdings from 25.07% to 26.25% of Ether’s circulating supply as prices crashed from roughly $4,000 to $2,700 in September 2021. Similarly, buy-the-dip trends can be spotted between late December 2021 and early January 2022 and the ongoing downswing.
The recent downswing appears to have been welcomed as a buy signal for whales as they increased their holdings by 1.94%, which could likely help Ethereum price pop higher.
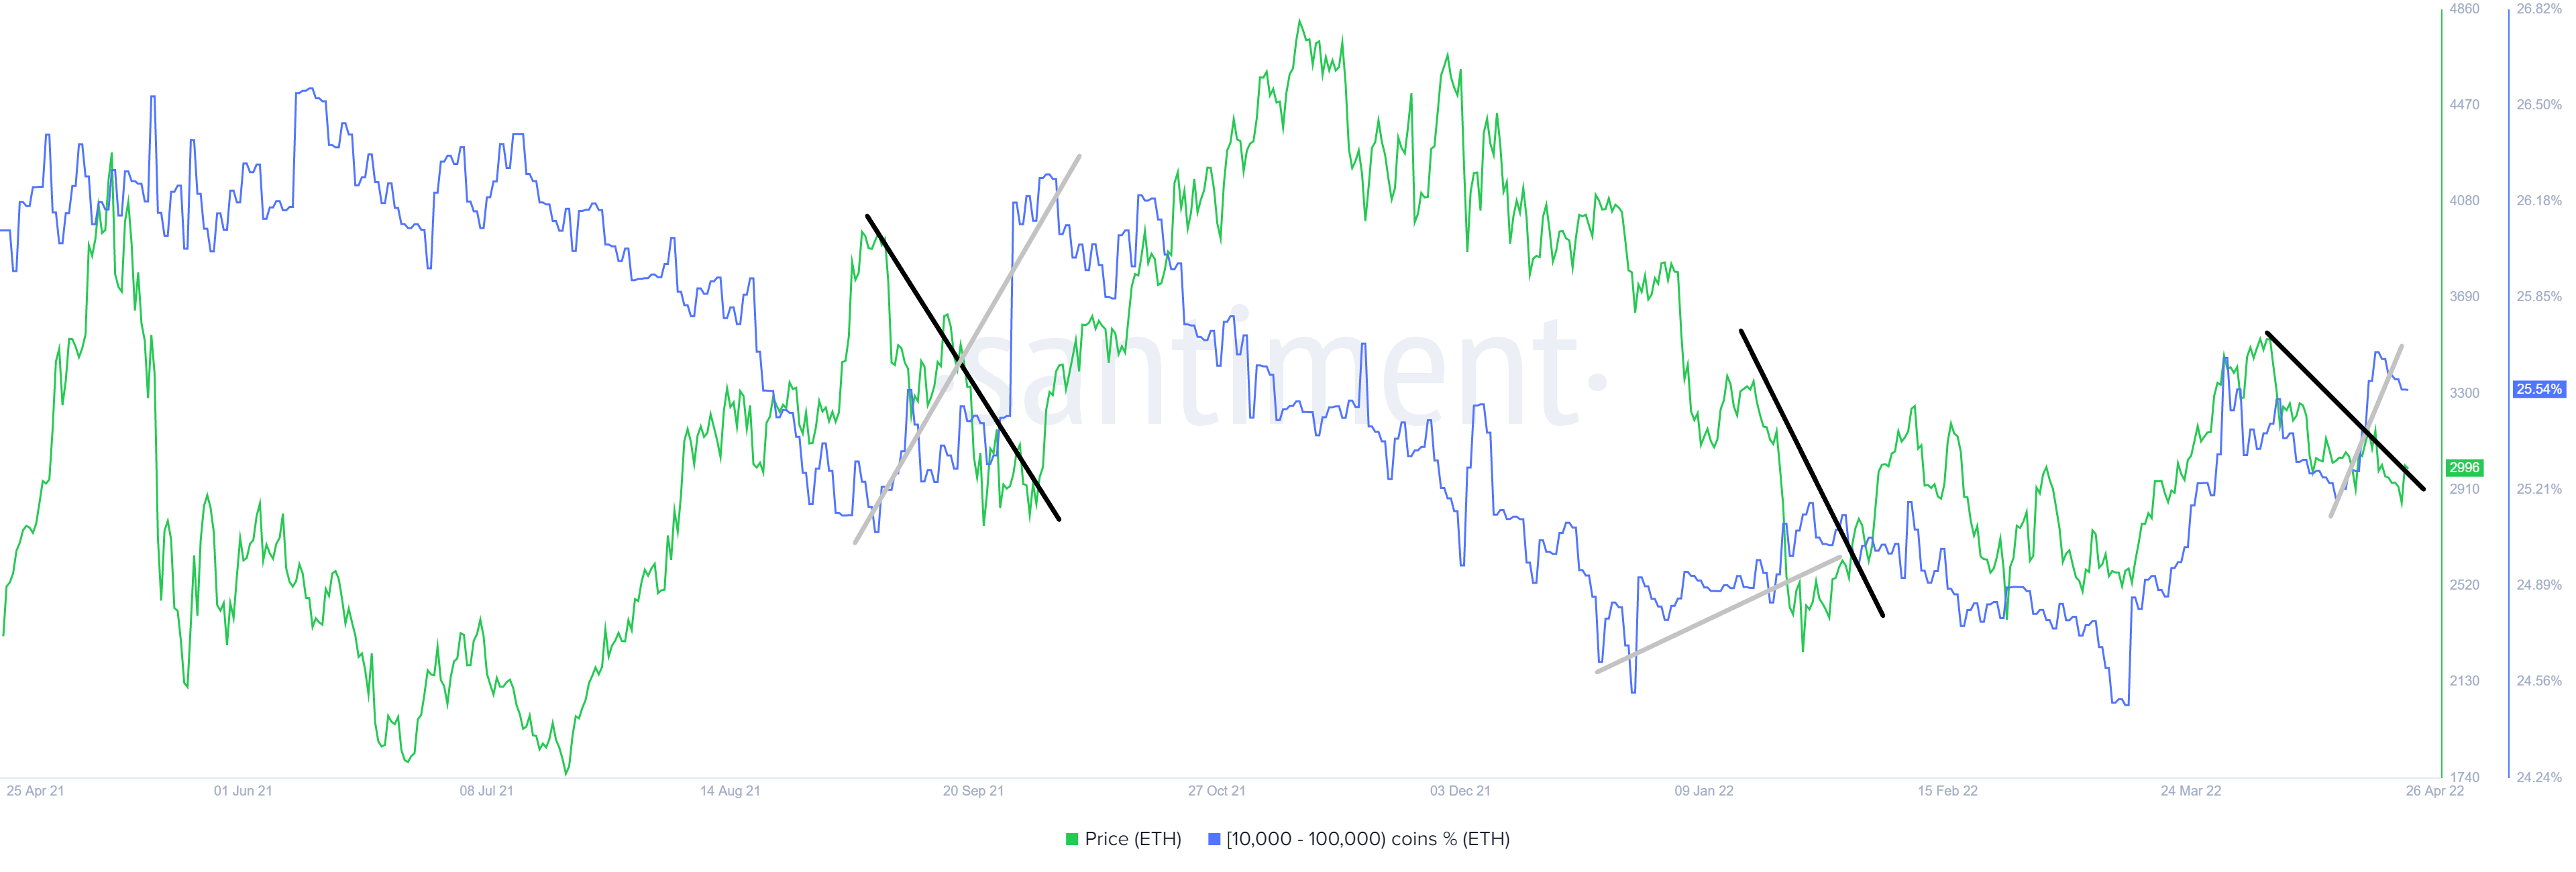
ETH supply distribution
Adding a tailwind to this bullish outlook is the increase in the volume of ETH outflows from trading platforms seen in the exchange net position change indicator. This index tracks the 30-day outflow of ETH and shows that nearly 1.5 million ETH has moved out of centralized entities’ wallets as of April 13, suggesting strong conviction among institutional investors and an effective reduction in sell-side pressure.
Such a massive outflow has only occurred six times in the entirety of Ethereum’s history.
-637865633846552413.png)
ETH net exchange position change
While the technicals and on-chain metrics are hinting at a bullish future, the first possibility, aka the triple bottom setup has a much more reliable outcome while the second one, where Ethereum price continues to rally from its current position will likely be a short-term uptrend.
Regardless of which scenario takes place, a decisive daily candlestick close below $2,439 will produce a lower low from a high time frame perspective and invalidate the bullish thesis.
In this case, the bears could take charge and catalyze a 30% crash to $1,706, which will allow market makers to collect the sell-stop liquidity from traders who opened long positions in July 2021.
Author

Akash Girimath
FXStreet
Akash Girimath is a Mechanical Engineer interested in the chaos of the financial markets. Trying to make sense of this convoluted yet fascinating space, he switched his engineering job to become a crypto reporter and analyst.


