Five bullish signals that suggest Ethereum price could hit $5,000
- Ethereum price is stuck trading between the 50-, 100- and 200-day SMAs, lacking volatility.
- A triple bottom setup around $2,652 could be the key to triggering an 85% upswing to retest the all-time high at $4,868.
- A three-day candlestick close below $2,439 will invalidate this outlook and potentially trigger a crash to $1,706 or lower.

Ethereum price has been on a downswing since its all-time high in November 2021, but the development of recent events suggests that a change is coming. While there could be a temporary drop, a massive upswing is likely to begin afterward.
Ethereum price at a junction
Ethereum price set a swing low at $2,652 on September 19 and rallied 83% in under two months to set an all-time high of $4,868. This impressive upswing was followed by a 55% downswing that pierced the $2,652 swing low. These two touches around the same level could be foreshadowing a triple bottom setup.
For this technical formation to be complete, ETH needs to slide lower by 13% and tag the $2,652 support level again. This move will complete the pattern and reverse the trend favoring bulls. In such a case, Ethereum price is likely to make a run at the 50% retracement level at $3,287.
Clearing the midpoint and flipping it into a support level will open the path for a move toward the range high at $4,868. In total, this run-up would constitute an 85% ascent and is likely to extend to the $5,000 psychological barrier.
However, investors need to exercise caution around the 200-day Simple Moving Average (SMA) at $3,492 and the $4,000 psychological level, as Ethereum price might face headwinds there. Such a move is likely to push the Relative Strength Index (RSI) lower to the 38.16 level. The last two times RSI tagged this level was in June and July 2021, when ETH was forming a base that would eventually lead to a 185% gain.
Therefore, the retracement forecasted by the technical perspective also supports a retest of the 38.16 level for RSI, hinting at a bullish outlook.
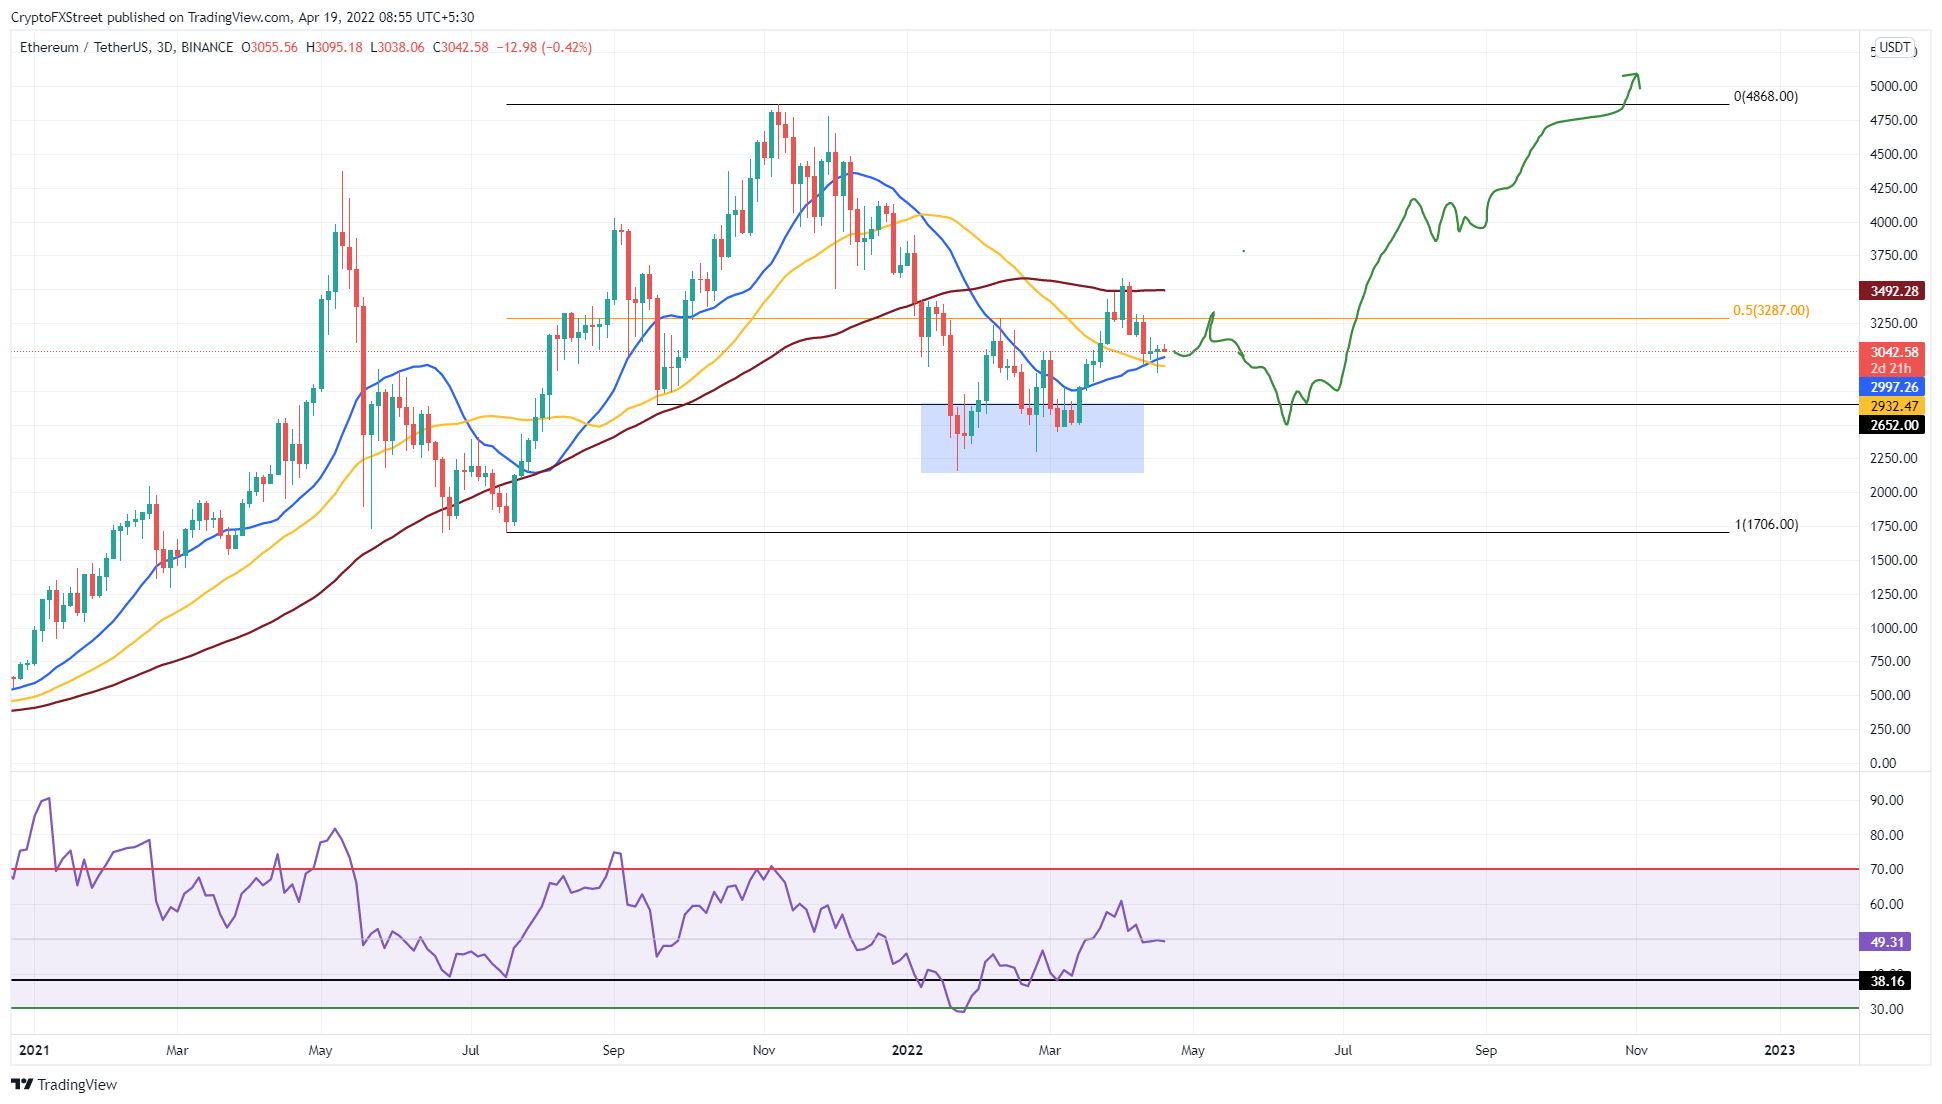
ETH/USDT 1-day chart
Supporting this optimistic outlook for Ethereum price is the exchange net position change indicator that tracks the 30-day outflow of ETH. Currently, this index shows that nearly 94,000 ETH has moved out of centralized entities’ wallets, suggesting a reduction in the sell-side pressure. Interestingly, this is the sixth time such a massive outflow has occurred, which in turn reveals the importance of this metric.
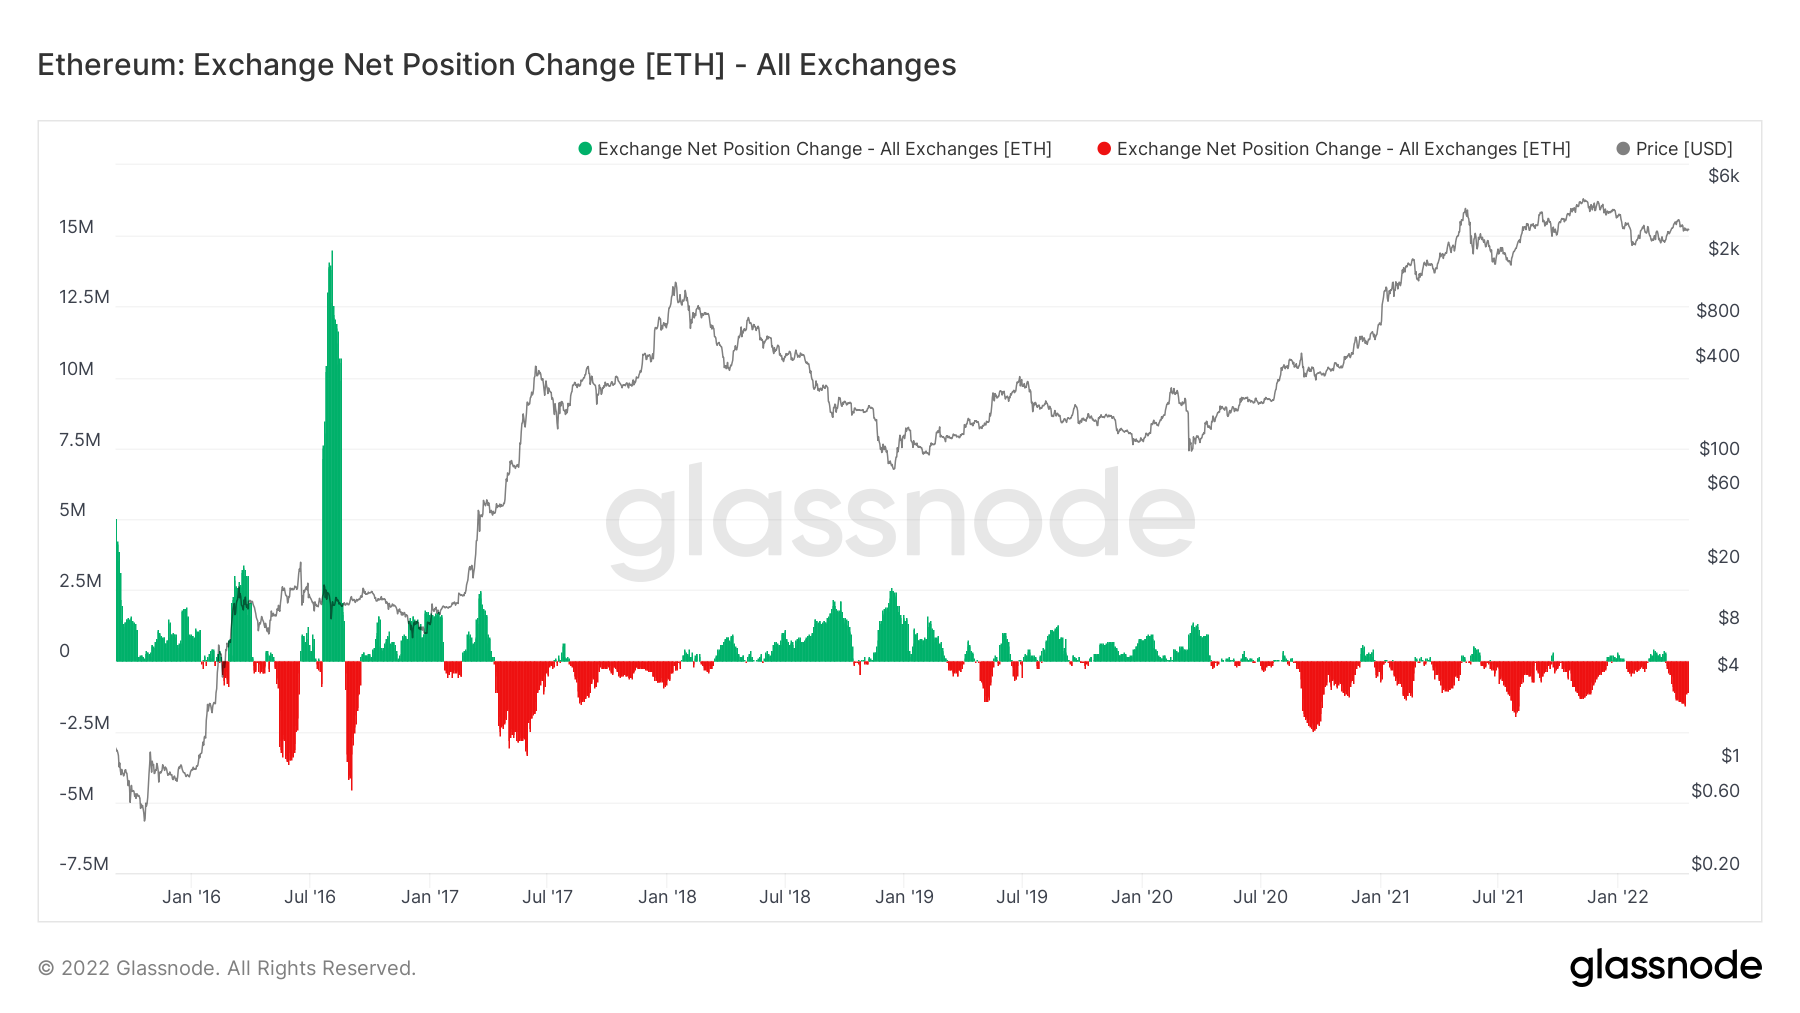
ETH exchange net position flow.
Furthermore, the number of one-hour active addresses on the Ethereum blockchain has hit a new all-time high at 60,330. This uptick suggests that new users or investors are interacting with the ETH blockchain and is considered a bullish indication.
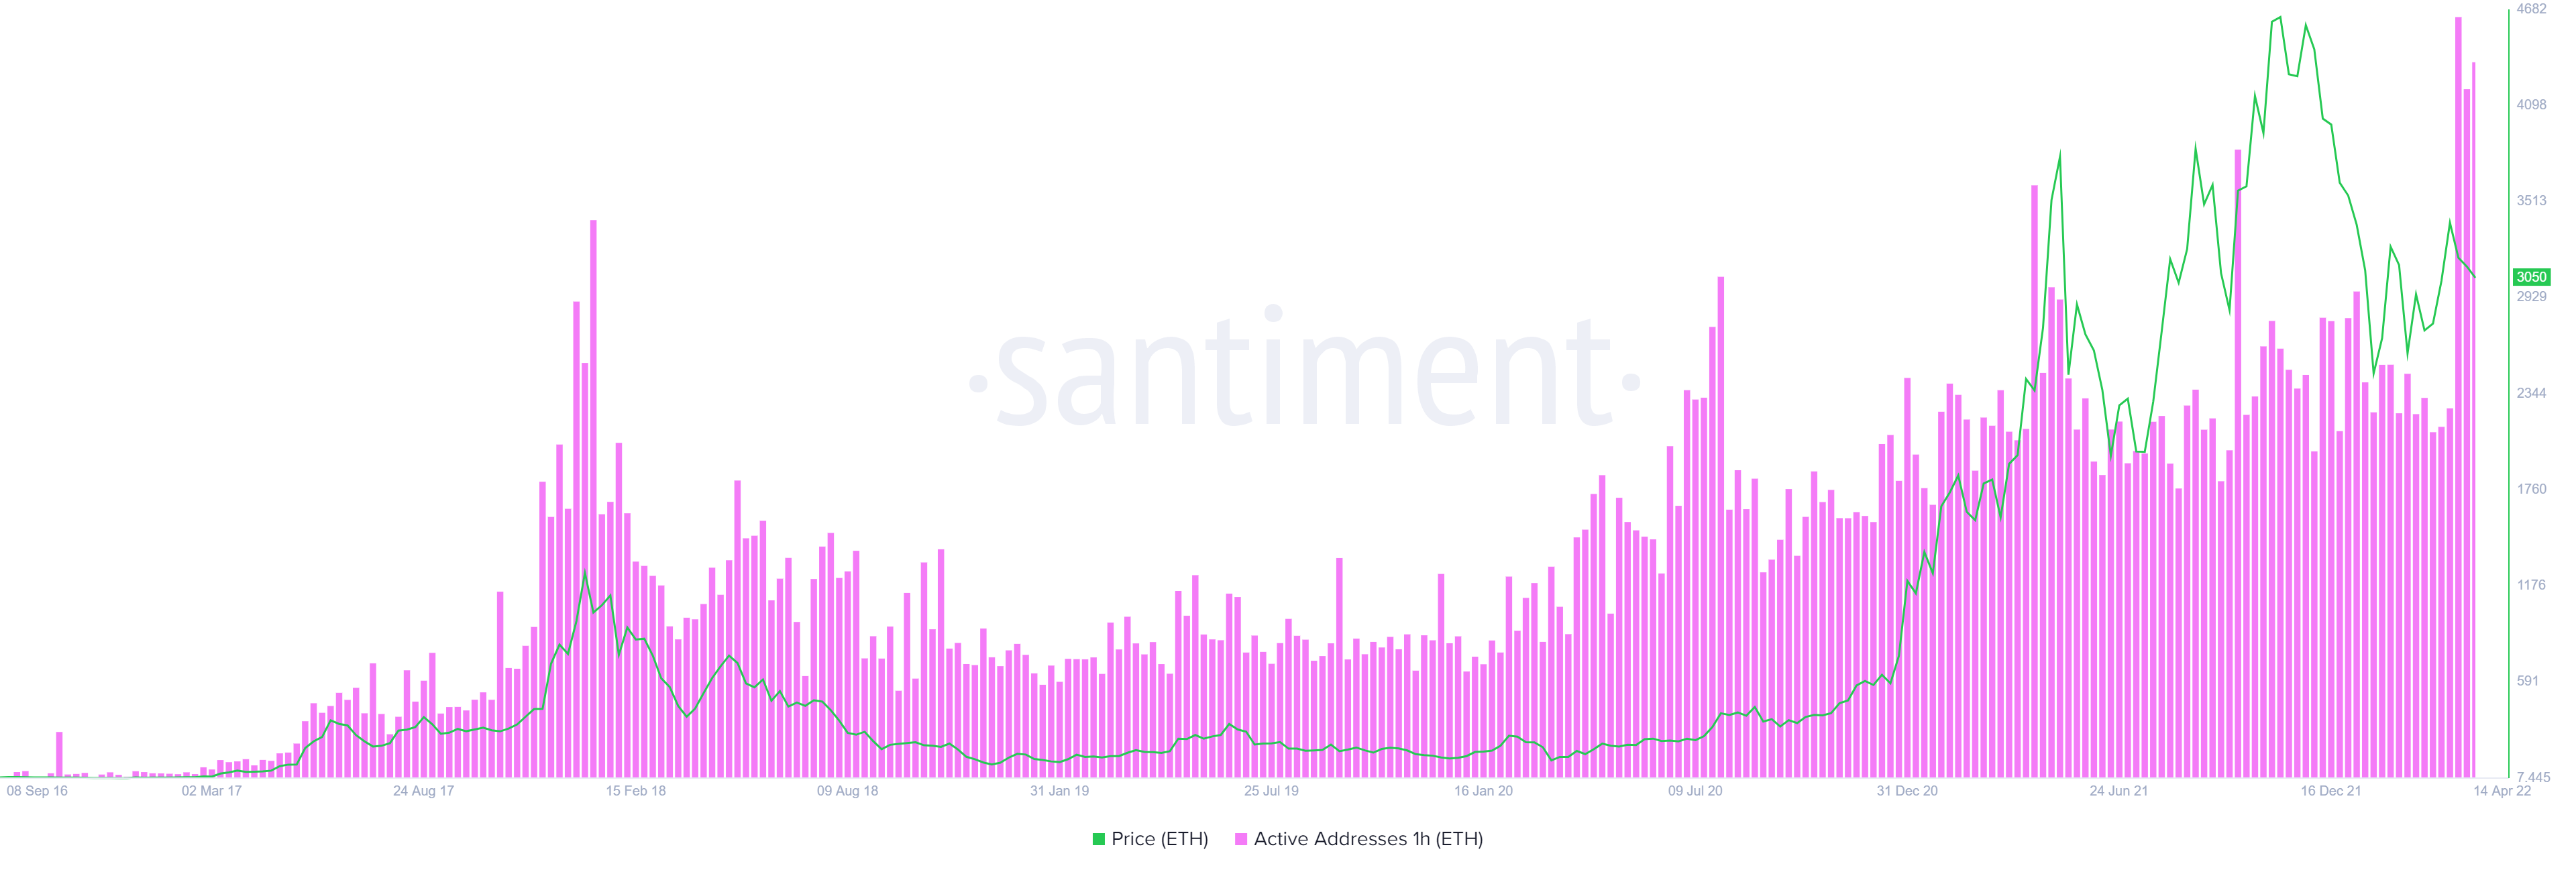
ETH 1-hour active addresses
Lastly, the long-term bullish outlook for Ethereum price is perfectly portrayed by the supply of ETH present on exchanges. This level has been in a downtrend since July 2020 and has slumped from 29.69 million to 14.96 million, representing an 11.73 million outflow of ETH in less than two years.
This development suggests that more investors are disinclined to sell and are moving their holdings to cold wallets or to DeFi platforms to earn interest, which indicates that they are optimistic about the performance of Ethereum price.
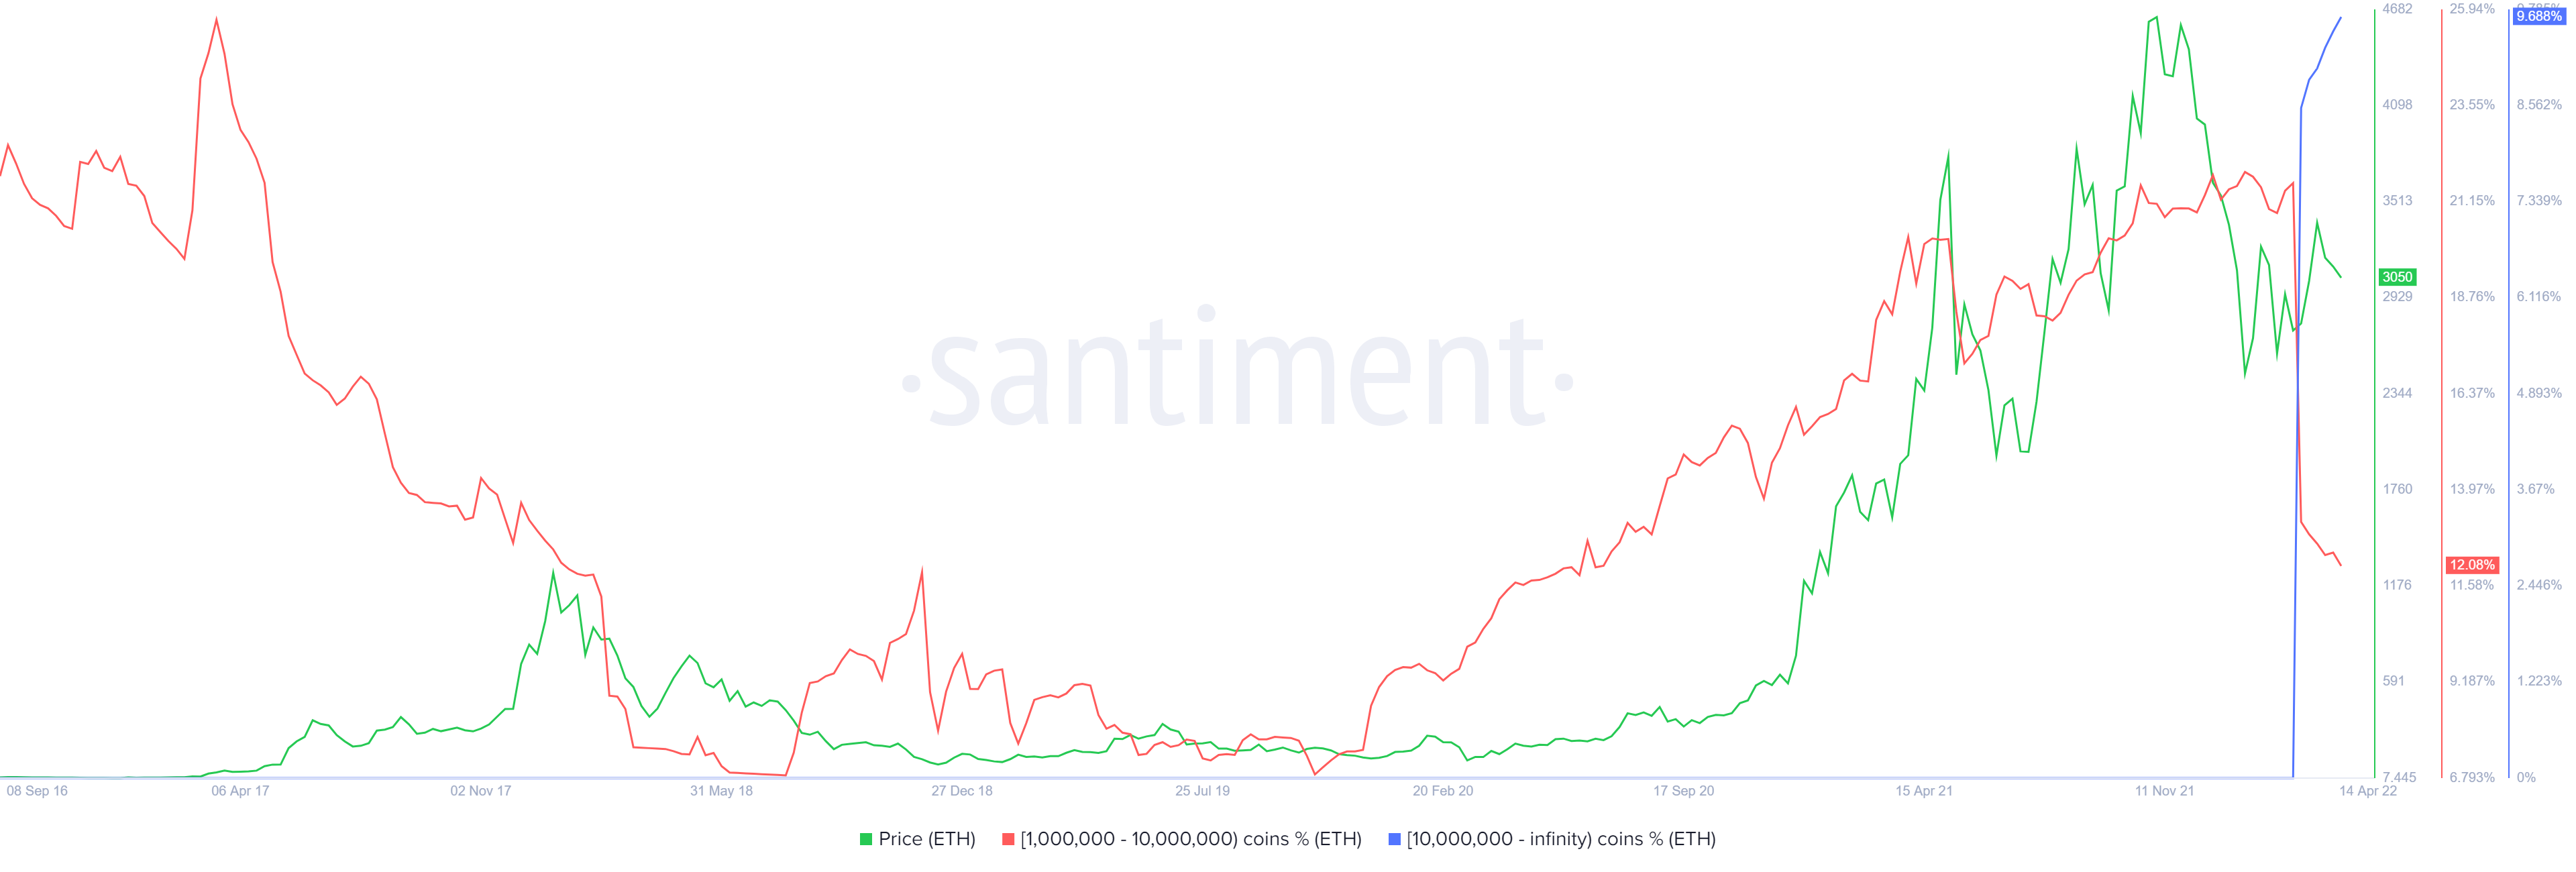
ETH supply on exchanges
A three-day candlestick close below $2,439 will invalidate this outlook by producing a lower low. In such a case, ETH bears could seize control and trigger a 30% crash to $1,706, which will allow market makers to collect the sell-stop liquidity.
Author

Akash Girimath
FXStreet
Akash Girimath is a Mechanical Engineer interested in the chaos of the financial markets. Trying to make sense of this convoluted yet fascinating space, he switched his engineering job to become a crypto reporter and analyst.


