Will ApeCoin price make a run for the all-time highs in this upcoming rally
- ApeCoin price has shattered its two-week downtrend by rallying 15%.
- This uptrend sets the stage for a further ascent that could propel APE to an all-time high at $17.46.
- A three-hour candlestick close below $9.64 will create a lower low and invalidate the bullish thesis.

ApeCoin price action over the past day shows signs that the bulls are back in town. The initial upswing, while interesting, sets the stage for more gains to come for APE.
ApeCoin price reveals a buy signal
ApeCoin price has shed roughly 31% between March 28 and April 7 and shattered the $12.28 support level. This downtrend was undone after APE rallied by 15% on April 10, suggesting the start of an uptrend.
An impulsive move often leaves behind demand zones, and for ApeCoin price, it extends from $10.82 to $11.12. As APE faces a resistance at $12.28, a retracement back to this support area seems likely.
As bears pull the ApeCoin price lower into the demand zone, investors can begin accumulating as the resulting upswing on the retest of the said area will be key in triggering an upswing. In such a case, APE will rally by 10% to contest the $12.28 hurdle; flipping this level into a support floor will open the path for $14.43, indicating a 30% gain.
In a highly bullish case, ApeCoin price could extend the run-up and tag its all-time high at $17.46.
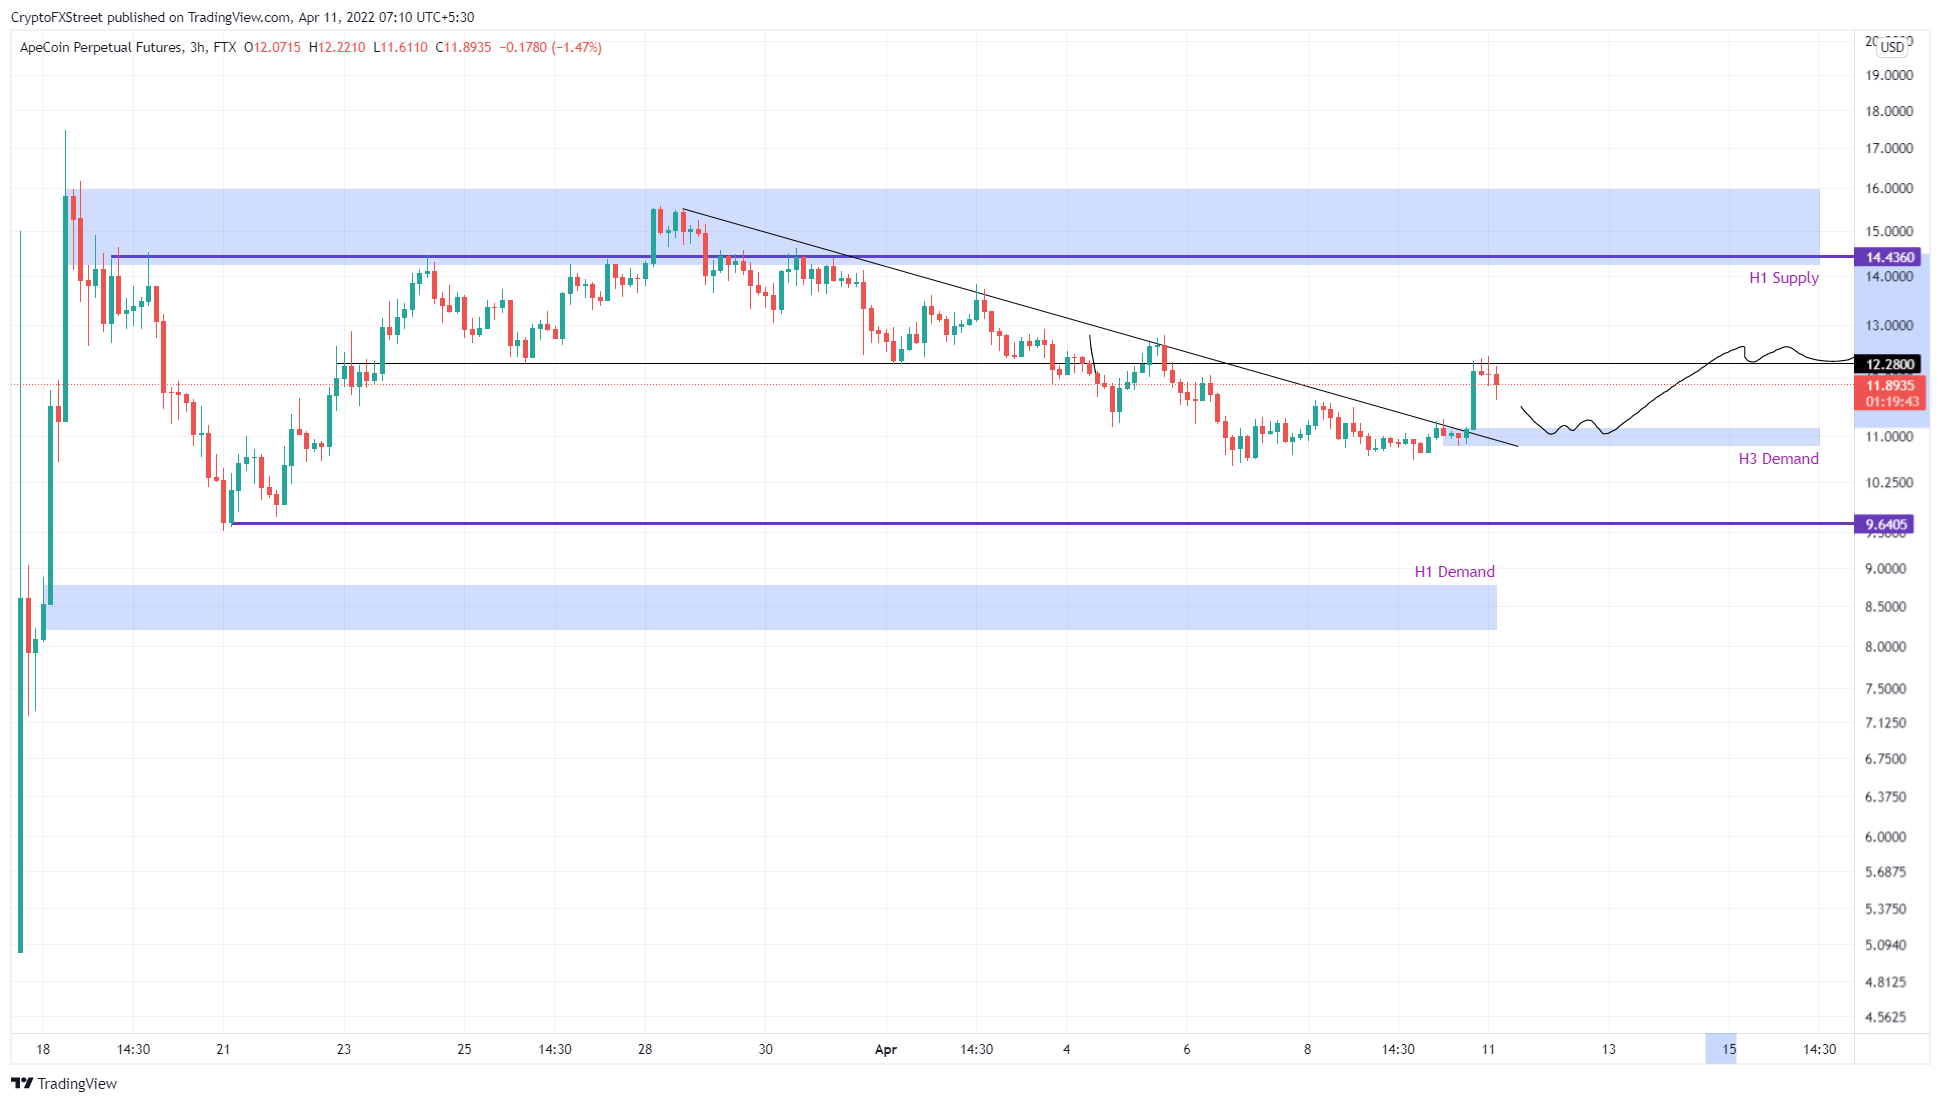
APE/USDT 3-hour chart
Supporting the uptrend in ApeCoin price is the supply distribution chart. This index tracks the number of APE tokens held by institutions or high net worth investors. Investors that have 100k to 1 million APE tokens have increased from four to 152 since March 10, denoting a 3,700% increase.
The same trend can be seen with the next category of wallets holding between 1 million and 10 million APE tokens. These investors grew in number from 183 to 192, suggesting a 5% increase in the same period.
The spike in the number of whale wallets indicates that these investors are confident in the bullish performance of ApeCoin price.
 [07.13.22, 11 Apr, 2022]-637852494476180071.png)
APE supply distribution
Regardless of the bullish outlook for ApeCoin price, a breakdown of the $10.82 level will invalidate the three-hour demand zone and open the path for further correction.
A three-hour candlestick close below $9.64 will create a lower low and invalidate the bullish thesis for ApeCoin price. In such a case, APE could crash to the $8.19 to $8.76 demand zone, in search of stable support areas.
Author

Akash Girimath
FXStreet
Akash Girimath is a Mechanical Engineer interested in the chaos of the financial markets. Trying to make sense of this convoluted yet fascinating space, he switched his engineering job to become a crypto reporter and analyst.



