Why Shiba Inu price could sneak in a 35% rally amid the bearish market sentiment
- Shiba Inu price is likely to retrace to the 70.5% retracement level at $0.0000148.
- A bounce off this barrier is likely to trigger a 35% ascent to the $0.0000201 hurdle.
- A four-hour candlestick close below $0.0000135 will invalidate the bullish thesis for SHIB.

Shiba Inu price shows the formation of an initial range that could allow investors an opportunity to accumulate. After a bounce off stable support levels, the emerging rally is likely to push SHIB beyond the range high.
Shiba Inu price readies for a quick run-up
Shiba Inu price dropped roughly 39% since May 5 and formed a base around $0.0000135. This was followed by a quick reversal that propelled SHIB by 32% in less than twelve hours, setting up a swing high at $0.0000179.
This move created a range that SHIB is currently bounded. As Shiba Inu price continues to pullback, it is looking for stable reversal points. The $0.0000144 to $0.0000152 is known as the buy zone and is the 62% to 79% retracement levels.
A dip into the buy zone would be a perfect opportunity for scalpers to take up a long position. Ideally, the reversal should occur around the 70.5% retracement level at $0.0000148. The emerging rally is likely to propel SHIB by 20% to the range high at $0.0000179.
Although the uptrend could be capped at this level, the immediate and significant resistance barrier is present at $0.0000201, which would indicate that SHIB needs to rally 35% to retest it. In some cases, the upside could be capped at the -27% retracement level at $0.0000191, bringing the Shiba Inu price gains to nearly 30%.
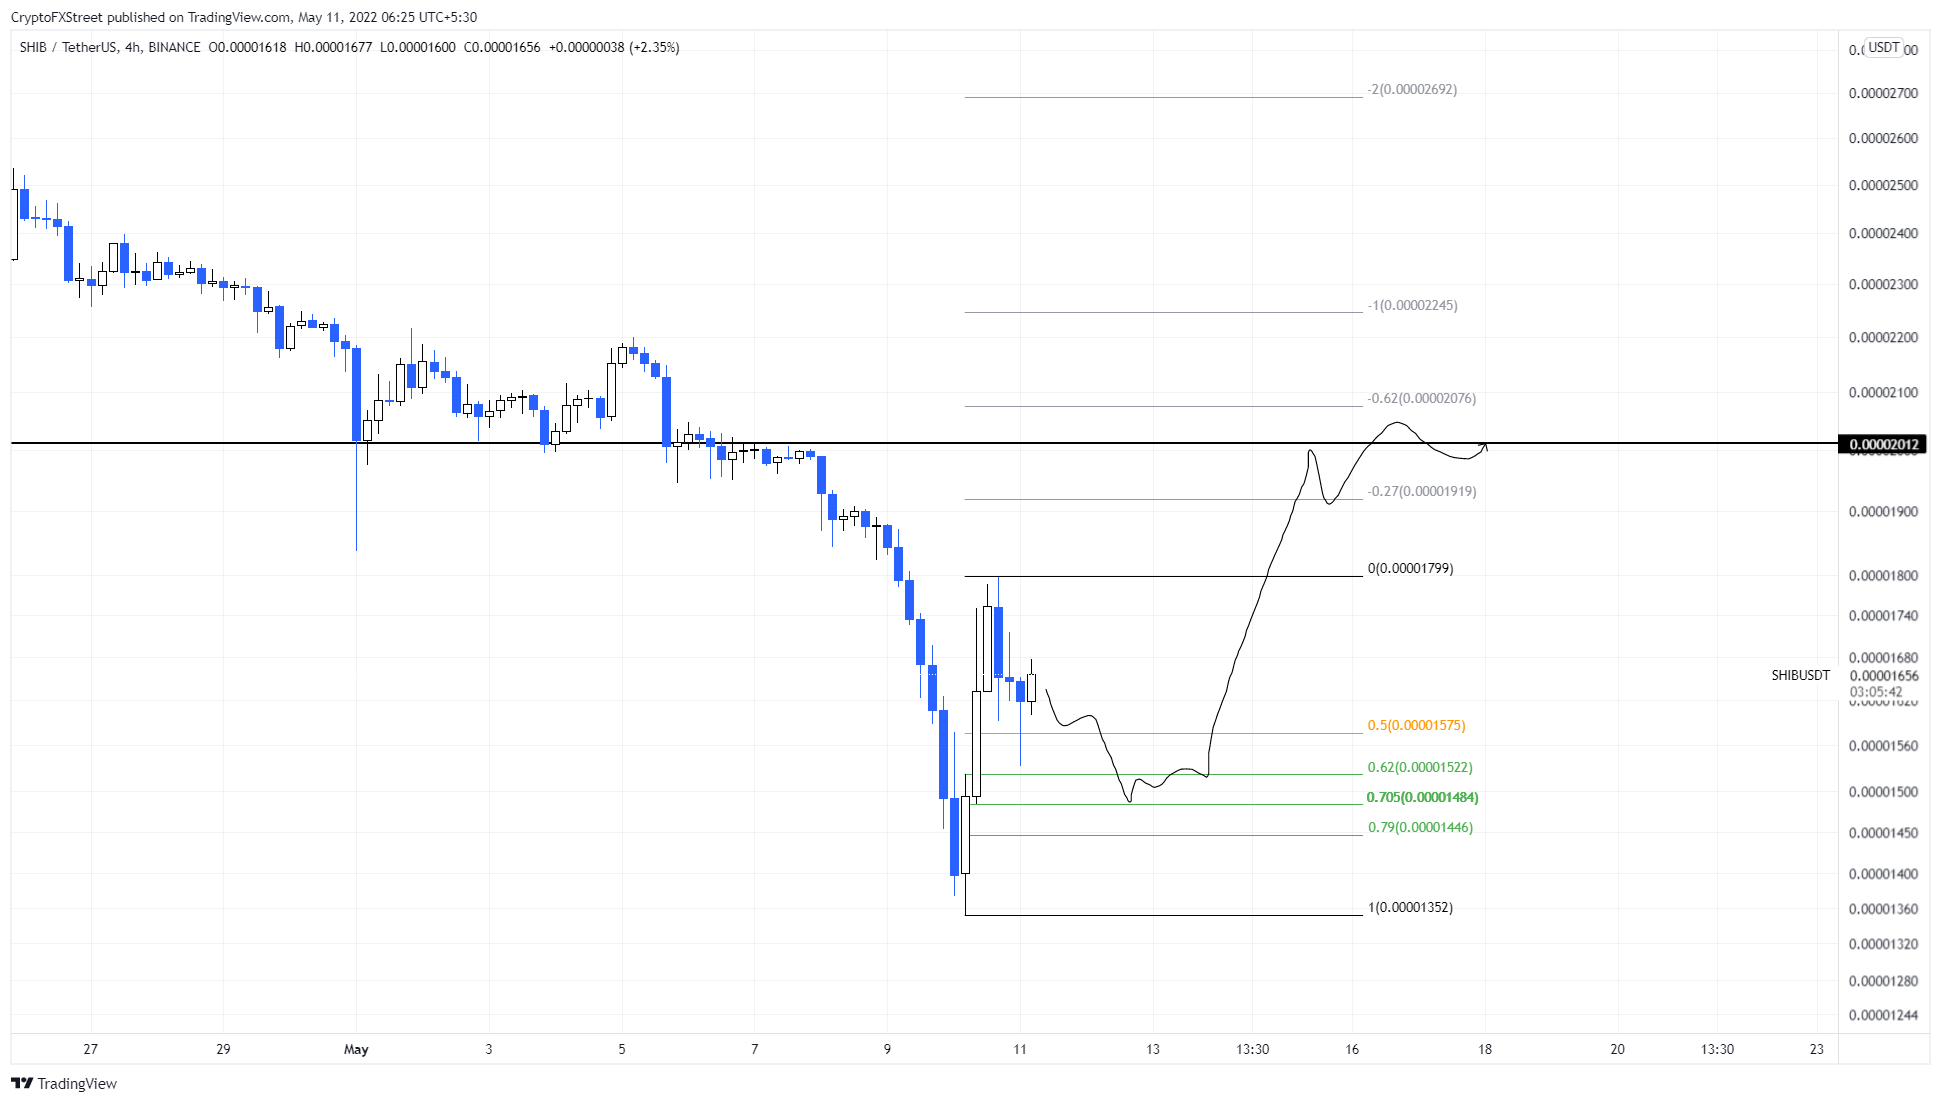
SHIB/USDT 4-hour chart
While things are looking gloomy due to the recent crash, a four-hour candlestick close below $0.0000135 will invalidate the bullish thesis for Shiba Inu price by creating a lower low.
In such a case, SHIB could crash lower to filled the fair value gap, extending from $0.0000135 to $0.00000726.
Author

Akash Girimath
FXStreet
Akash Girimath is a Mechanical Engineer interested in the chaos of the financial markets. Trying to make sense of this convoluted yet fascinating space, he switched his engineering job to become a crypto reporter and analyst.



