- Dogecoin price provides a strong Fibonacci cluster at the current $0.05 level.
- Dogecoin price revisits historical trend line from the 2021 bull run.
- Invalidation of the entire bearish downtrend can be a breach above $0.085.
UPDATE: Dogecoin price has found some interim support above $0.05, the key round level where it set its floor between February and April 2021 before its last parabolic rally to the all-time highs above $0.70 in May 2021. Since then, a relentless downtrend was established and, over the past week, it accelerated to the aforementioned – and very relevant – support. The whole cryptocurrency market seems to be battling to stay above psychological levels over the past couple of days, with Bitcoin just above $20,000 and Ethereum right above $1,000. It is easy to see the huge relevance of bulls defending these levels, as a potential capitulation could mean another cascade of stops triggered with still lots of room to go below. DOGE bulls are banking on the confluence of Fibonacci retracement levels analyzed in this article.
Dogecoin: -92% from the Musk SNL peak.$DOGE pic.twitter.com/P1J9Zn55yE
— Charlie Bilello (@charliebilello) June 12, 2022
Dogecoin price should be on everyone’s watchlist as the technicals indicate a significant level in play, which warrants the idea for a highly volatile market in the coming weeks.
Dogecoin price is one to watch
Dogecoin price first anomalous signal is the recent breach of a historical trend line, which has been highly anticipated for months here at FXStreet. It seems the stars are aligning in favor of a bullish rally, but it is better to play the market safe than jump in too early. A devastating collapse to $0.02 could occur if the bulls fail to provide support.
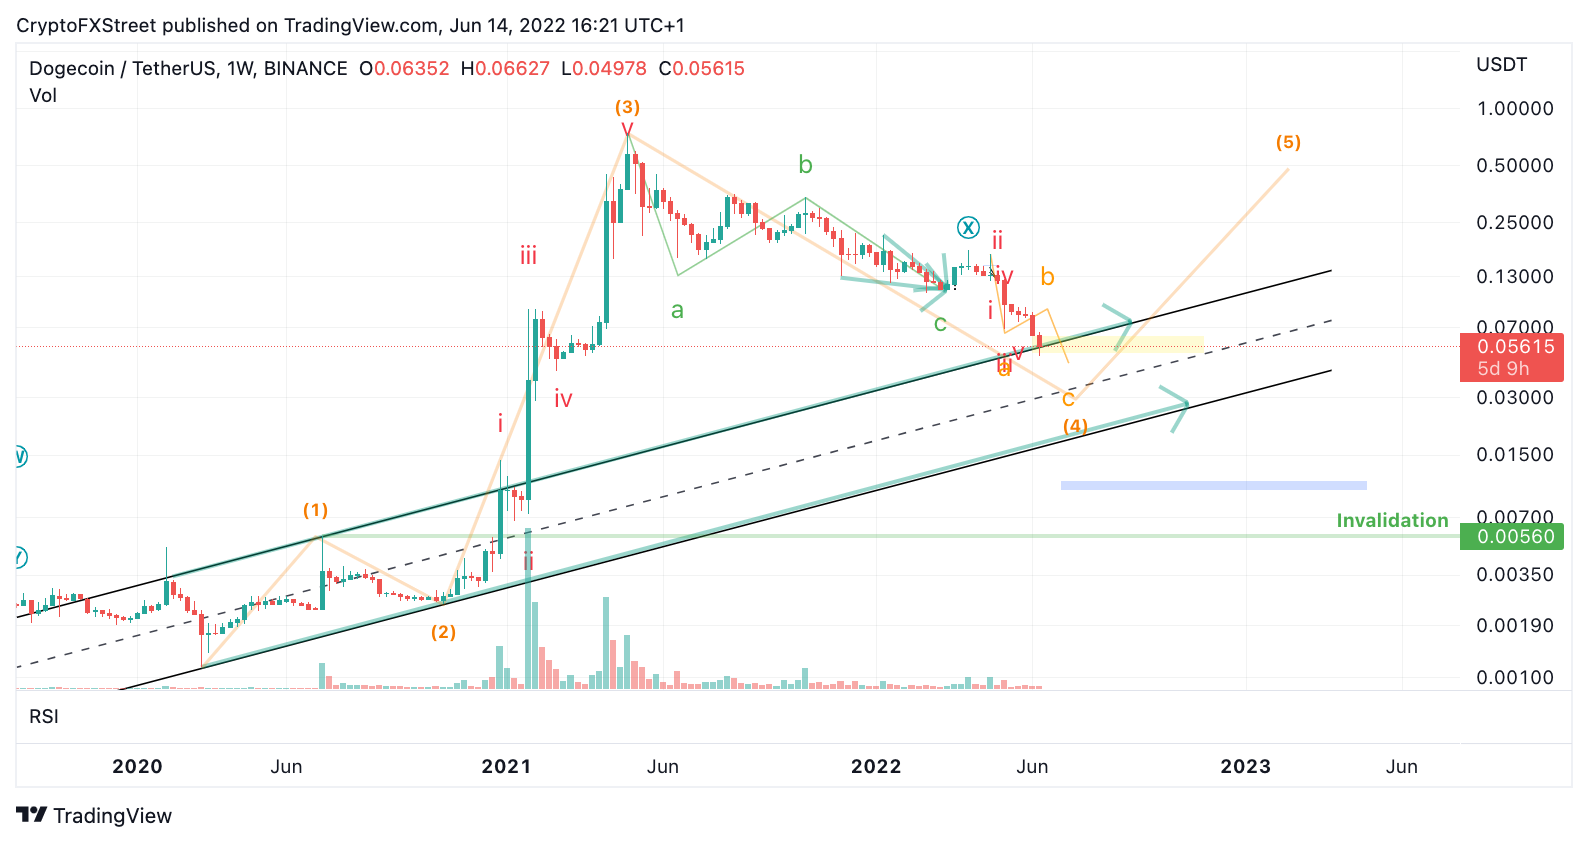
DOGE/USDT 1-Week Chart
Dogecoin price shows interesting technicals as the crypto market bleeds into oblivion. A Fibonacci projection tool from the first impulse down into the X wave rally that ended in April at $0.18 has a 61.8% Fib level at $0.05. A Fibonacci retracement tool surrounding the all-time lows and all-time highs has a 38.2 level% at $0.05 as well. A Fibonacci cluster is when two Fibonacci methods line up in the same vicinity, signaling a strong level of interest.
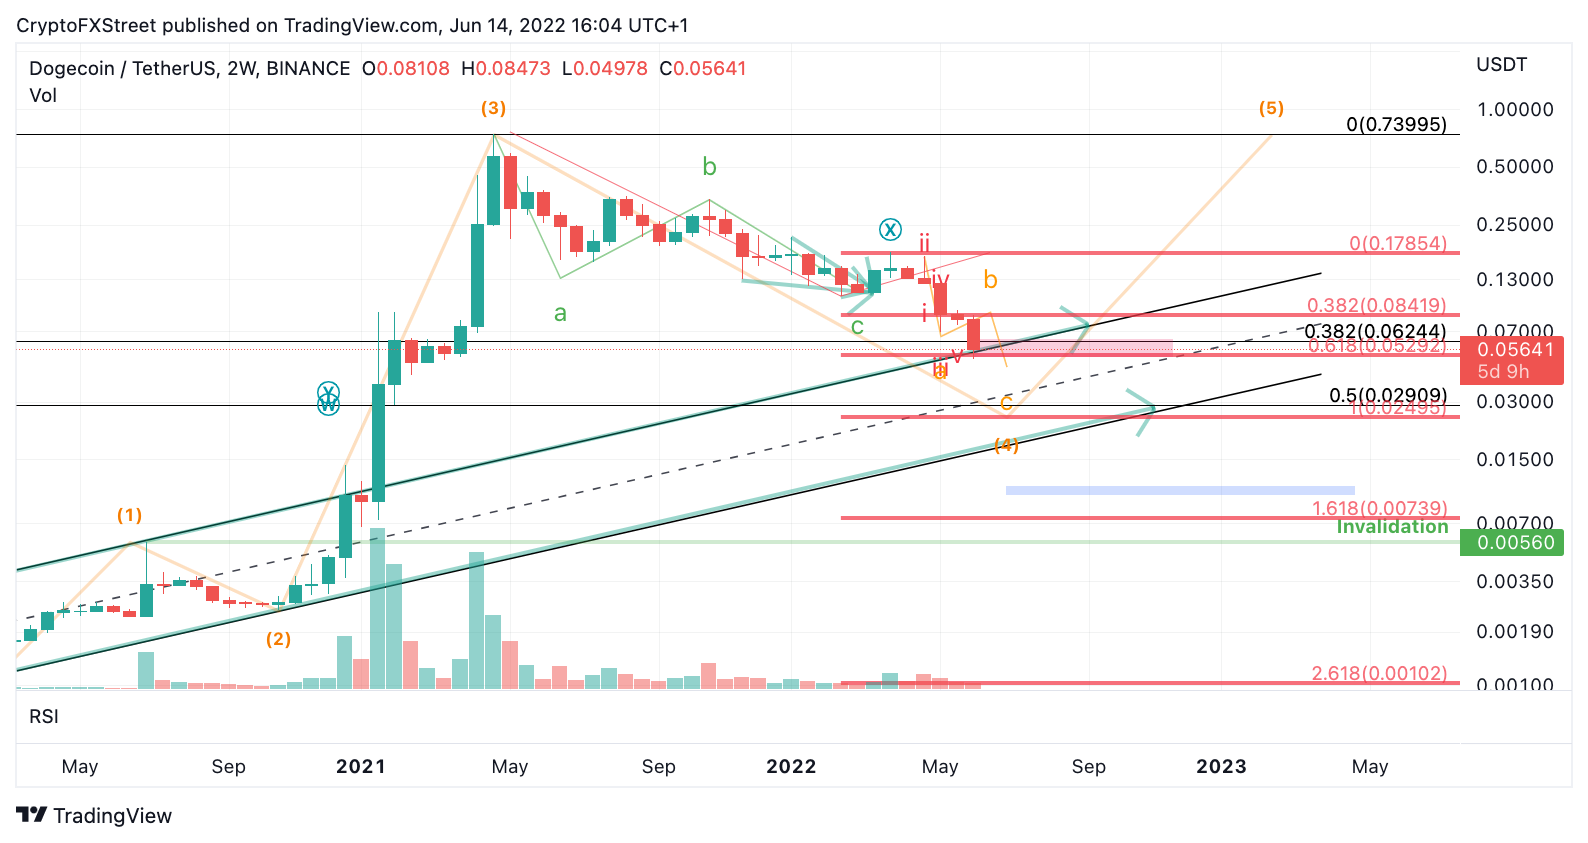
DOGE/USDT 2-Week Chart
Invalidation of the bearish downtrend is a breach above $0.085. The entire bearish downtrend could be deemed over if the bulls can accomplish said price action. A rally towards the all-time highs at $0.70 would result in an 1125% increase from the current Dogecoin price.
Information on these pages contains forward-looking statements that involve risks and uncertainties. Markets and instruments profiled on this page are for informational purposes only and should not in any way come across as a recommendation to buy or sell in these assets. You should do your own thorough research before making any investment decisions. FXStreet does not in any way guarantee that this information is free from mistakes, errors, or material misstatements. It also does not guarantee that this information is of a timely nature. Investing in Open Markets involves a great deal of risk, including the loss of all or a portion of your investment, as well as emotional distress. All risks, losses and costs associated with investing, including total loss of principal, are your responsibility. The views and opinions expressed in this article are those of the authors and do not necessarily reflect the official policy or position of FXStreet nor its advertisers. The author will not be held responsible for information that is found at the end of links posted on this page.
If not otherwise explicitly mentioned in the body of the article, at the time of writing, the author has no position in any stock mentioned in this article and no business relationship with any company mentioned. The author has not received compensation for writing this article, other than from FXStreet.
FXStreet and the author do not provide personalized recommendations. The author makes no representations as to the accuracy, completeness, or suitability of this information. FXStreet and the author will not be liable for any errors, omissions or any losses, injuries or damages arising from this information and its display or use. Errors and omissions excepted.
The author and FXStreet are not registered investment advisors and nothing in this article is intended to be investment advice.
Recommended Content
Editors’ Picks
Binance CEO calls CFTC suit “disappointing” as district court halts Voyager $1 billion sale to Binance.US

Voyager’s deal with Binance’s United States entity, Binance.US, faced another hurdle on March 27, the same day that the Commodity Futures Trading Commission (CFTC) went after the crypto exchange. This is the second time in the span of a month that Voyager’s deal has been objected against by the government.
90% of Ethereum supply leaves exchanges as regulators struggle to classify ETH as Security or Commodity

Ethereum is known not only as the second-biggest cryptocurrency but also as the second-generation cryptocurrency. The blockchain not only brought Decentralized Finance (DeFi) to the crypto space but also framed a target on its back following its Proof of Stake transition plan.
This is how EOS holders responded to the network's EVM testnet launch, what to expect this week

The first milestone on the EOS Network Foundation’s roadmap, the completion of the EOS EVM (Ethereum Virtual Machine) code, was achieved on March 22, starting the countdown to the launch of the EOS testnet. Well, it is finally here and the community is elated as it brings them closer to the mainnet release on April 14.
XRP price recovers above $0.44 as court ruling approaches, will Ripple win against the SEC?

XRP price has kept its momentum, flashing green on the one-day timeframe as the countdown to the Ripple vs SEC lawsuit continues. The remittance token is moving in tandem with our prediction last week, soaring by a significant margin to secure a place among the best-performing cryptocurrencies on a one-week timeframe.
Bitcoin: Should you trust this BTC sell signal or wait for $34,000?

Bitcoin price shows a clear picture of its rally after it breached a long-term bullish pattern in mid-January. As the rally takes a breather, sell signs have started to emerge, which is putting investors in a confused state.