Which altcoin can perform better than others at the current market bounceback?

Buyers keep controlling the situation on the market; however, some coins have come back to the red zone.
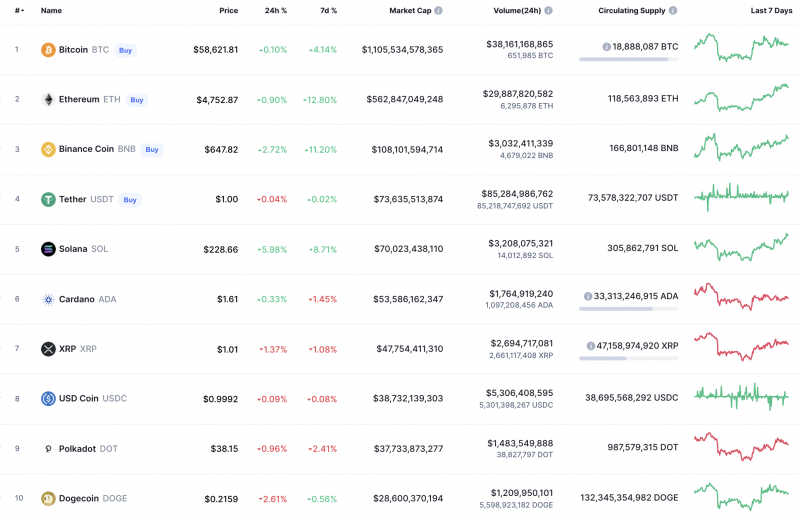
Top coins by CoinMarketCap
BTC/USD
Yesterday, the two-hour EMA55 kept the Bitcoin (BTC) price in a sideways consolidation. In the afternoon, buyers tried to test the $60,000 level, but the daily high was only set at $59,250.
By the end of the day, the pair rolled back to the average price area.
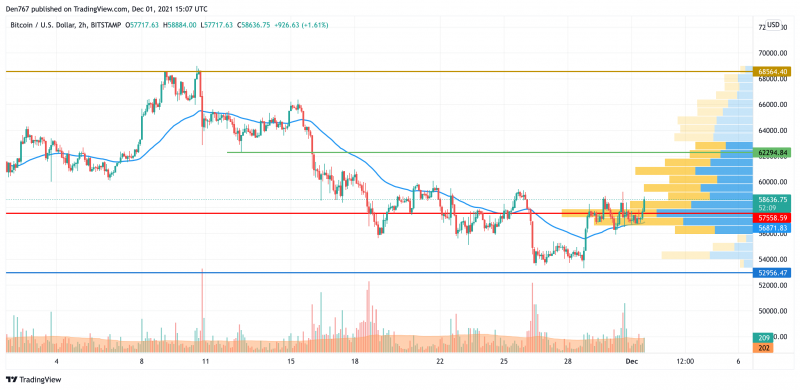
BTC/USD chart by TradingView
Today, attempts to recover to the psychological level of $60,000 USD may continue, but if the bears push the moving average EMA55, the price can retrace to the $55,287 level.
Bitcoin is trading at $58,611 at press time.
XRP/USD
Yesterday, the XRP price held above the average price level and consolidated above the psychological level of $1. Today, it is the second-biggest loser among the top 10 coins.
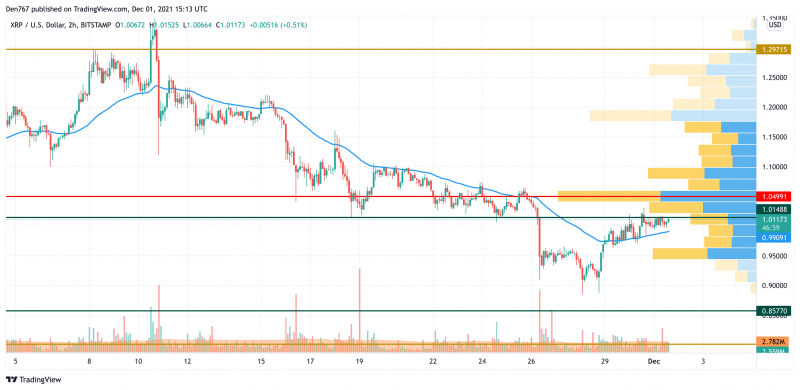
XRP/USD chart by TradingView
Today, given the positive sentiment of market participants, the recovery may continue to the resistance of $1.10.
XRP is trading at $1.0105 at press time.
ADA/USD
Cardano (ADA) is also located in the bearish area as the price of the altcoin has declined by 0.80% since yesterday.
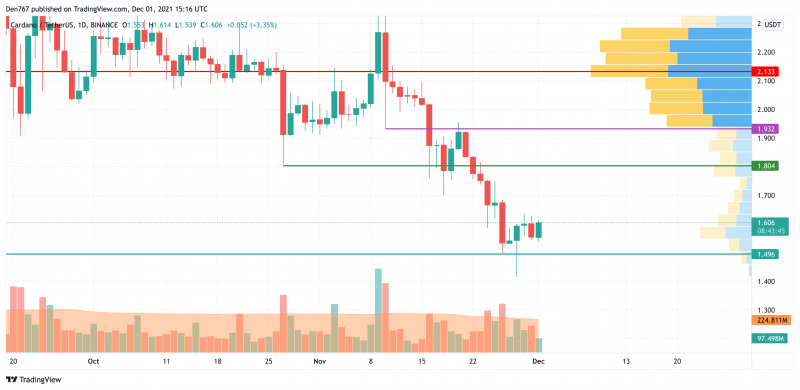
ADA/USD chart by TradingView
Despite the fall, Cardano (ADA) keeps consolidating after it has successfully bounced off the support at $1.496. If the situation does not change, and buyers hold the initiative, the rise may continue to the nearest resistance at $1.80.
Such a scenario is relevant until mid-December.
ADA is trading at $1.606 at press time.
SOL/USD
Solana (SOL) is the biggest gainer today as the growth of the coin has made up almost 5% over the last day.
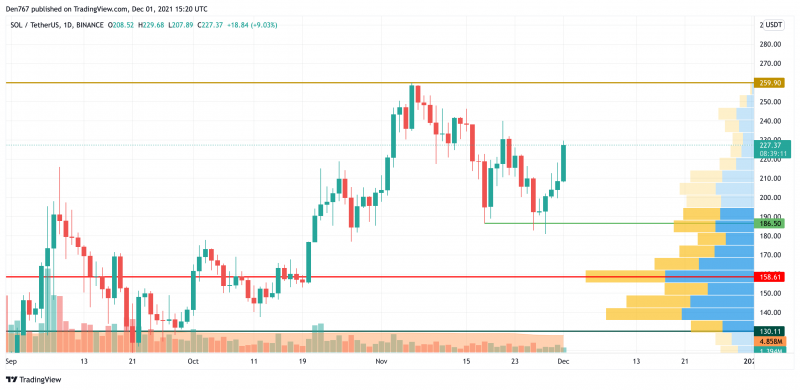
SOL/USD chart by TradingView
Solana (SOL) is slowly moving to its peak at $259.90. The buying training volume remains low, which means that traders are still accumulating efforts. If bears cannot seize the initiative, there are good chances to see a new pear at around the vital mark of $300.
SOL is trading at $227.55 at press time.
AVAX/USD
Avalanche (AVAX) is not an exception to the rule as it is also located in a bullish trend.
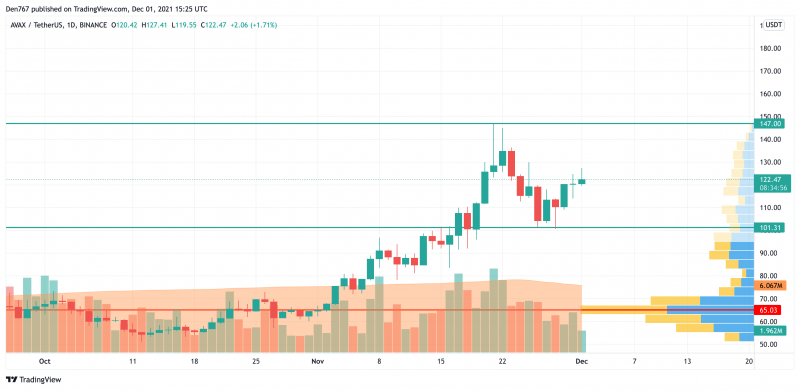
AVAX/USD chart by TradingView
AVAX is located in a wide channel from the technical point of view, and neither bulls nor bears are dominating. In this case, the more likely price action is continued sideways trading between the level of $110 and $130. Buyers have the opportunity for a rise if they can get to the $140 zone.
AVAX is trading at $122.47 at press time.
Read full original article on U.Today
Author

Denys Serhiichuk
U.Today
With more than 5 years of trading, Denys has a deep knowledge of both technical and fundamental market analysis.


