Warning: 150,000 Bitcoin tokens about to flood the market could trigger sell-off
- Bitcoin price is at an important junction in its recovery rally that could decide its macro outlook.
- Investors need to exercise caution as the Mt Gox exchange plans to release 150,000 BTC to its customers.
- A dead cat bounce that pushes the big crypto up to significant levels seems plausible before a crash begins.

Bitcoin price is attempting to move higher against a massive cluster of resistance levels, all of which are working to stop its bullish momentum. Investors need to be careful trading around this level as it could witness some serious volatility in the market.
Mt Gox drama is coming to an end
Bitcoin price is well above the $21,000 level after the rally over the last 24 hours. This volatility comes as Mt Gox, the attorney Nobuaki Kobayashi, and an appointed trustee in the rehabilitation process revealed that they were preparing to make payments to customers.
Although the plan was originally approved in 2018, it was confirmed in 2021 but the BTC that will be sent to the affected customers has dropped from 850,000 to roughly 150,000. However, a closer look at the on-chain metrics shows Mt Gox has 137,890 BTC in its exchange reserve.
At the current price of $21,700, the 150,000 BTC would be worth $3.25 billion.
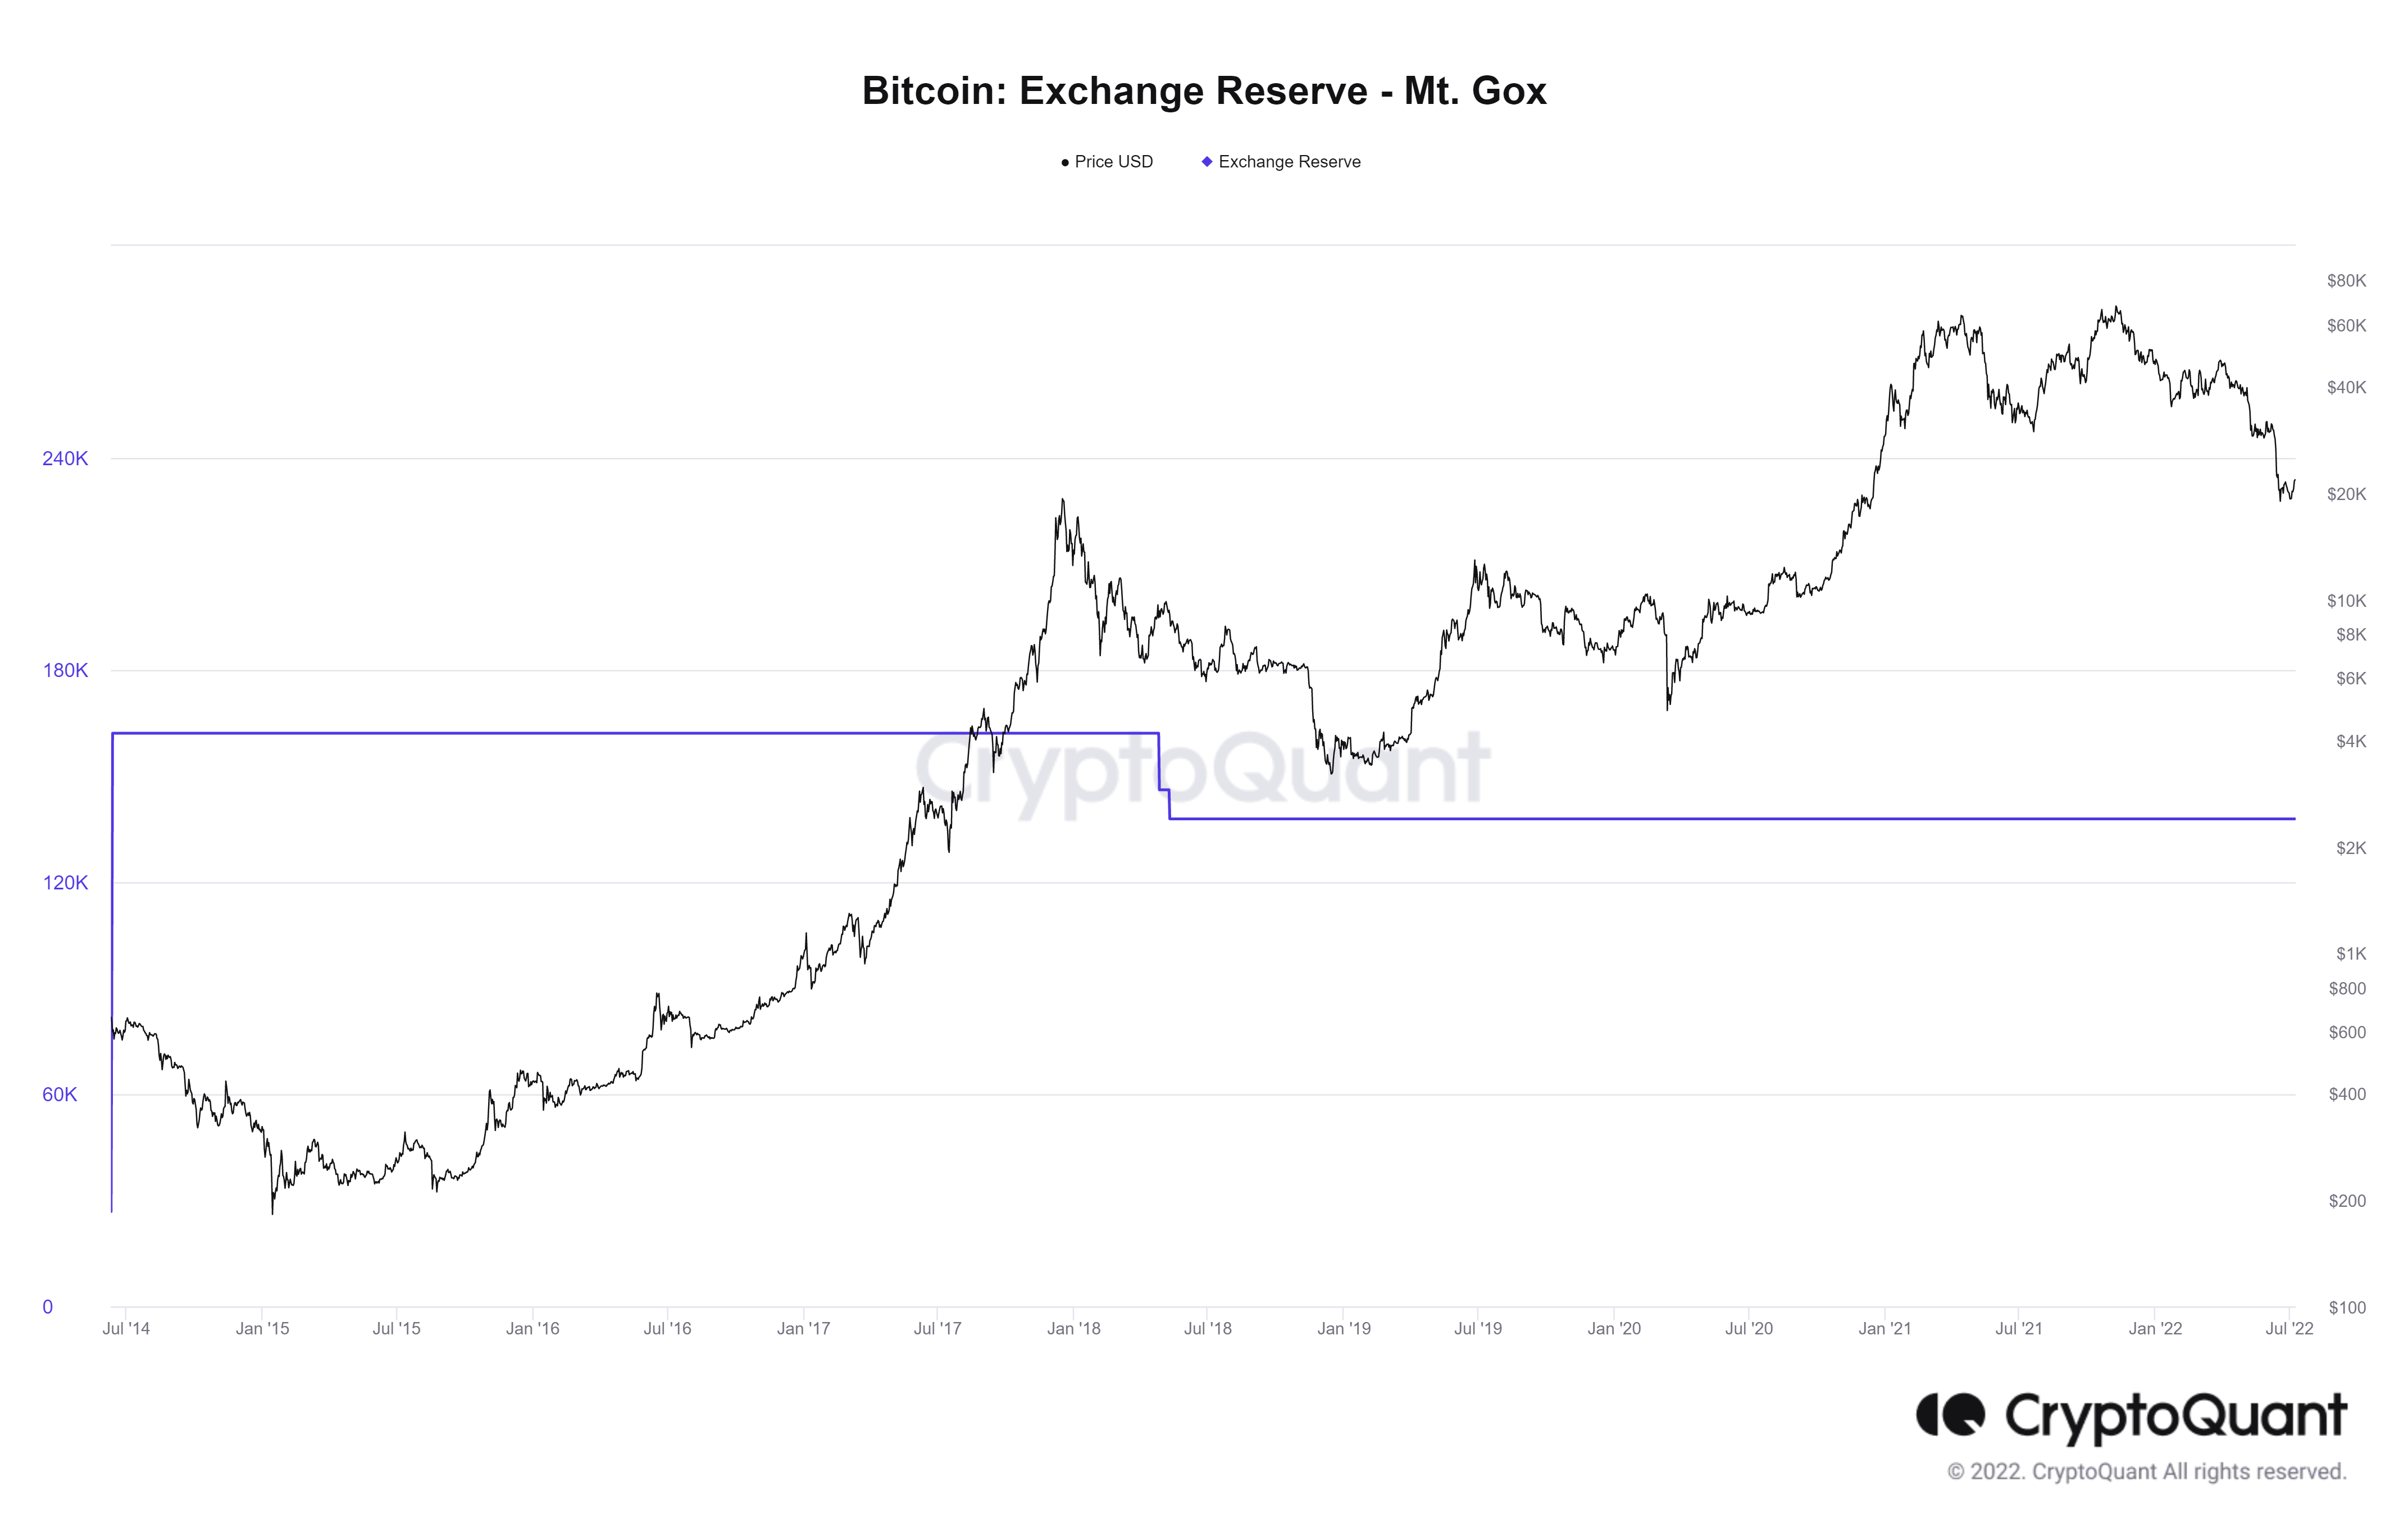
BTC exchange reserve Mt. Gox
An educated guess suggests that even if 50% of the holders decide to sell their holdings, it would add a tremendous amount of selling pressure to the already weak and battered BTC bulls. Hence, it could trigger a massive sell-off.
Some even speculate that it could catalyze a black swan event in and of itself.
So, let’s take a look at Bitcoin price and how it would react if such an unlock were to happen and what levels could support the potential crash.
Bitcoin price and ramifications
Bitcoin price has rallied 27% in its recovery attempt after the brutal sell-off to $17,605. While this move has caused many altcoins to undergo massive bounces. Over the last 24 hours BTC has climbed 7% and is currently retesting the 200-week Simple Moving Average (SMA).
This hurdle is extremely significant from a historical standpoint and has marked the bottom of each Bitcoin cycle with a little deviation below it. However, BTC price created history on this break by producing not one but four weekly candlestick closes below this level.
Some speculate that this recovery rally could pierce through the 200-week SMA and tag the $25,000 psychological level. Even before this level is revisited BTC price needs to go through the intermediate resistance level at $23,480
This run-up could merely be a dead cat bounce, luring in unbeknownst investors into a trap before the market falls back down again.

BTC/USDT 1-week chart
Supporting this move up to $25,000 is IntoTheBlock’s In/Out of the Money Around Price (IOMAP) model. This index shows that there are relatively few underwater holders up to roughly $25,000.
On the other hand, the support cluster of investors that have their holdings “In the Money” are likely to keep the market underpinned at those levels. Market participants can expect these investors to even add more to their holdings and push BTC price up with little-to-no resistance.
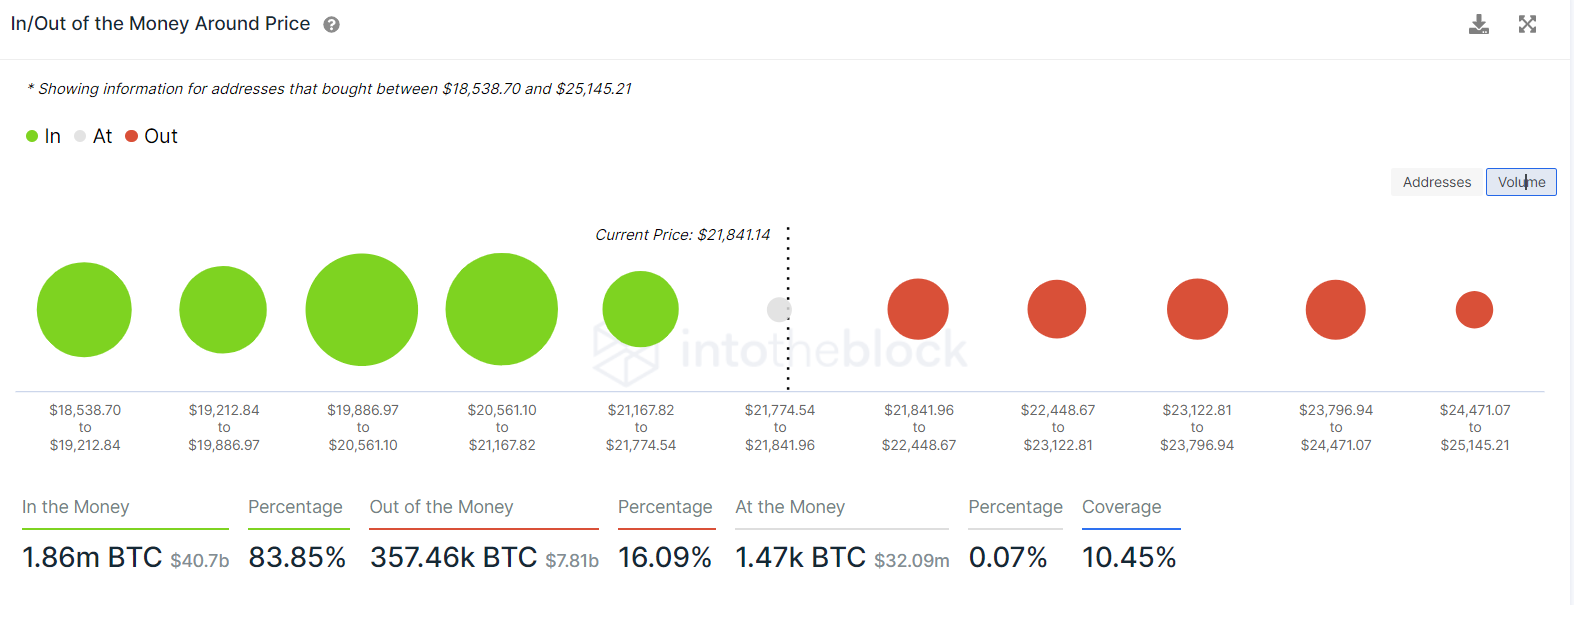
BTC IOMAP
While the dead cat bounce might seem on the surface like the beginnings of a strong bull run, and all rainbows and sunshine, things could turn around quickly.
Adding credence to this thesis are recent emails sent to Mt Gox users about the rehabilitation process. If these 150,000 BTC are sent to users, they could flood the market with excessive selling pressure and trigger the second leg of the dead cat bounce scenario for Bitcoin price, which is a brutal sell-off.
In such a case, investors can expect BTC to revisit the $19,065 support level, which is the midpoint of the Void, extending from $29,424 to $11,898. Hence, a breakdown of ths barrier could be the key to triggering the next leg down to $11,898 or the support levels present above it.
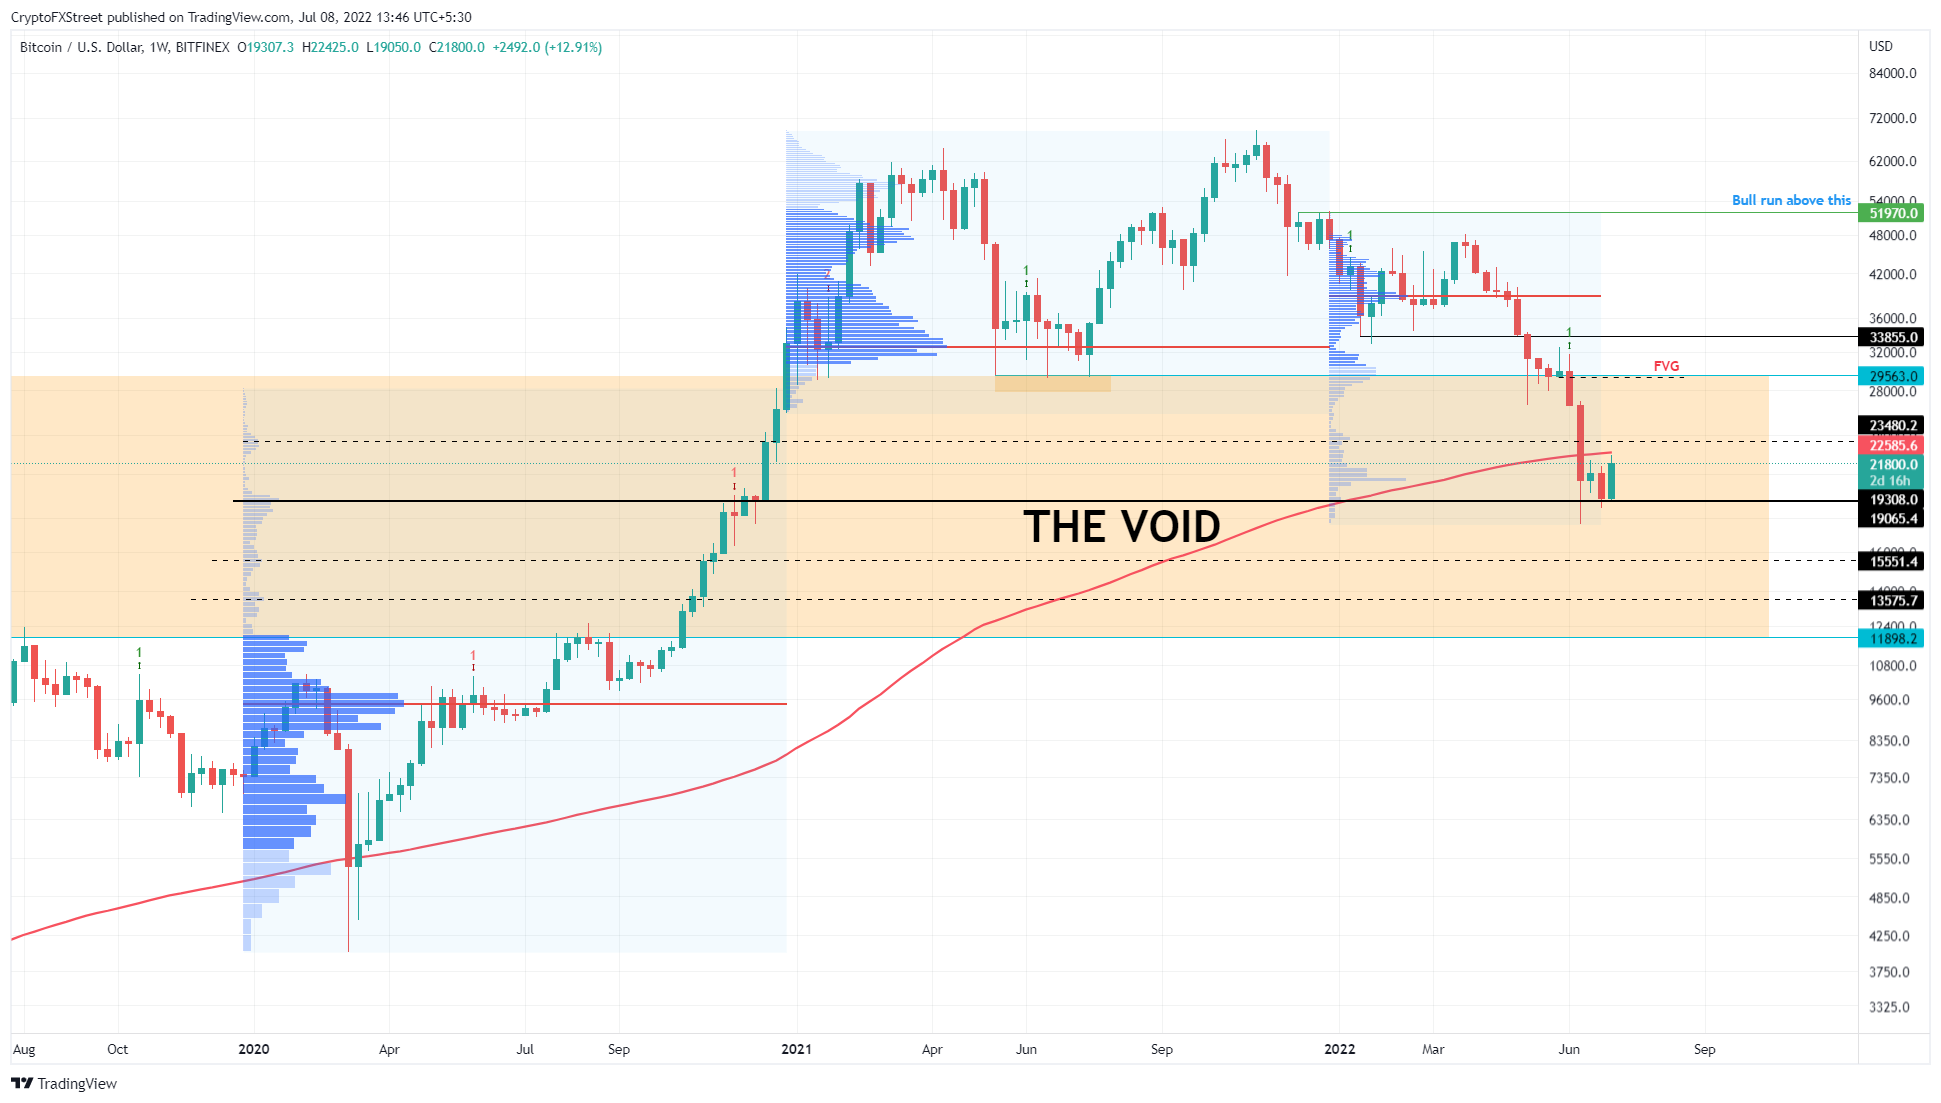
BTC/USDT 1-week chart
Further adding more the bulls woes is the four-hour chart attached below. This imgae shows that the 200-week SMA is not the only threat plaguing BTC.
The confluence of the 200-four-hour SMA, 200-four-hour Exponential Moving Average (EMA), and the 34-Day EMA (green) at roughly $22,700 , indicates that the upside is capped roughly around the 200-Week SMA.
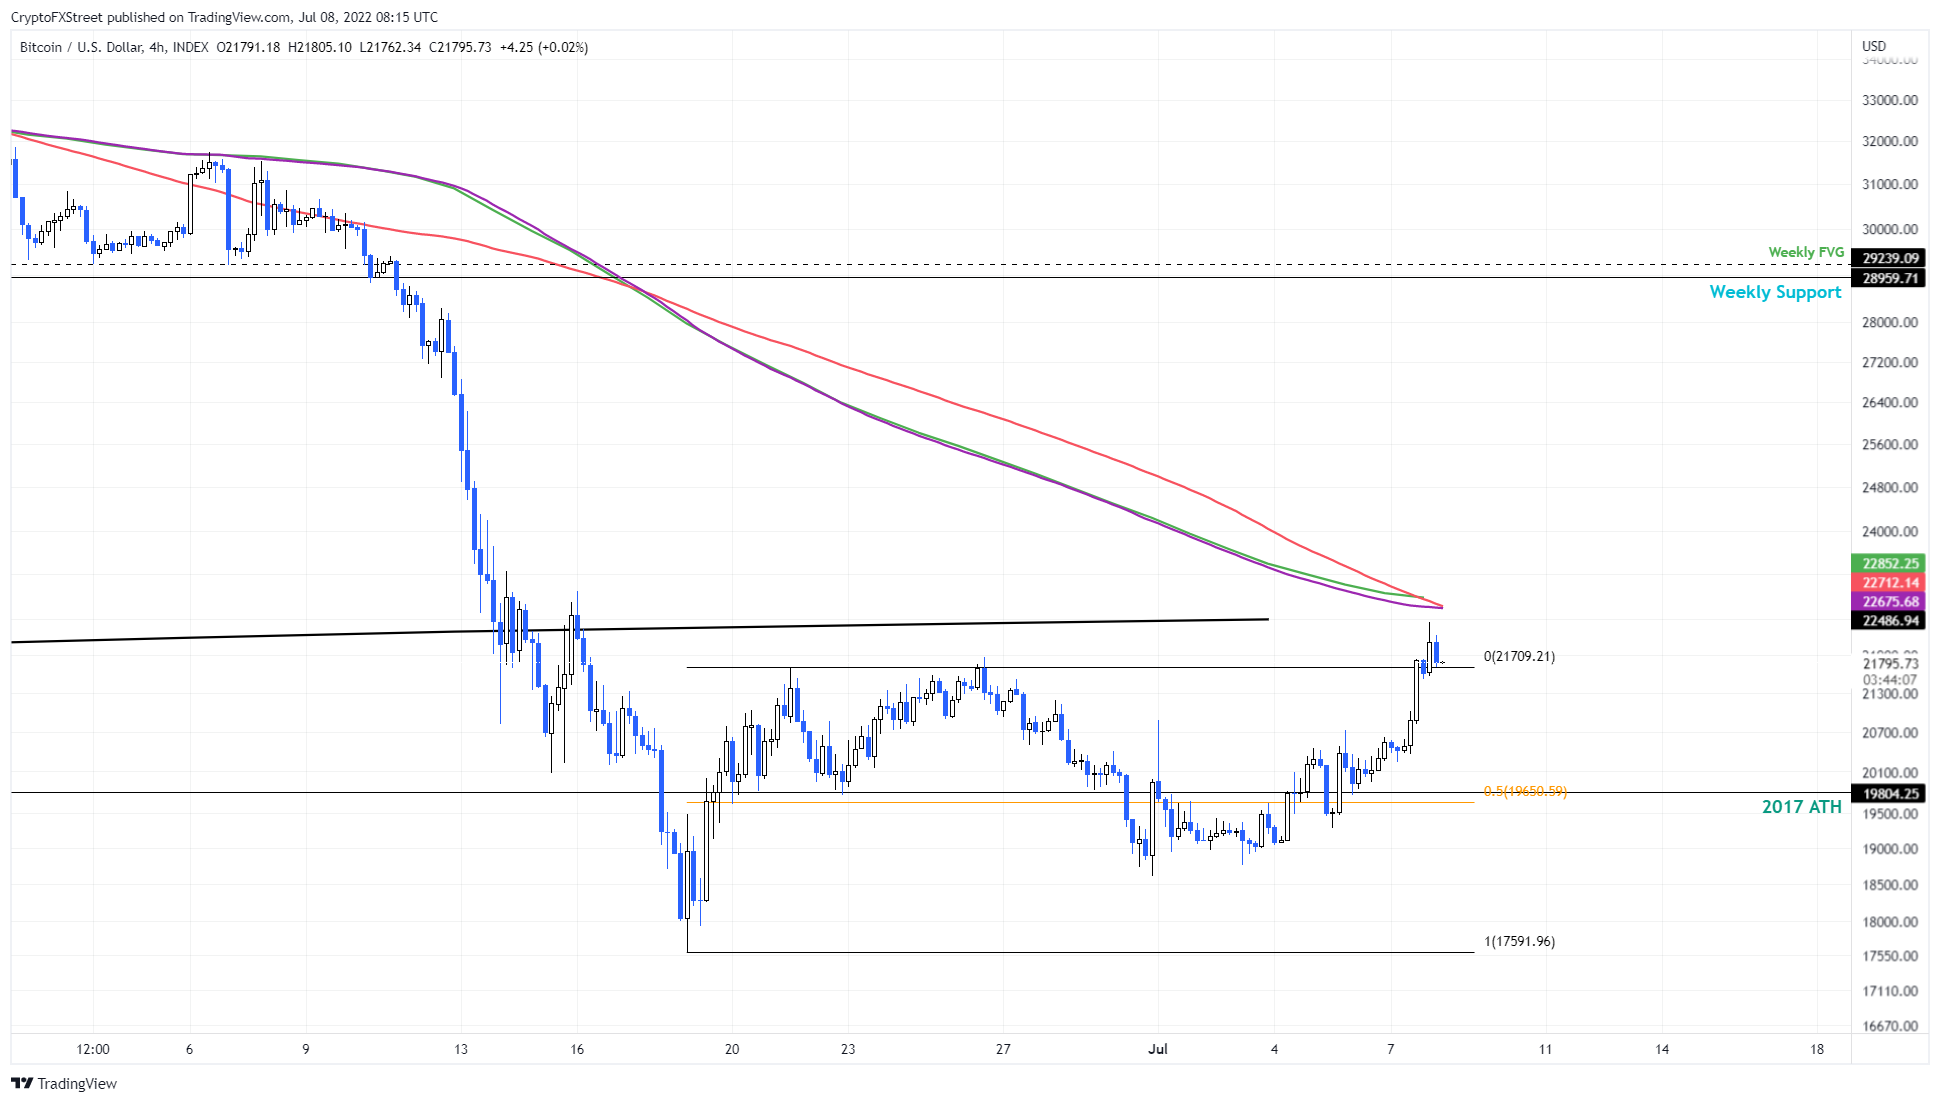
BTC/USDT 4-hour chart
While things might look extremely bearish for Bitcoin price, a daily candlestick close above $29,563 would be the start of an uptrend, as this move would eliminate all the losses experienced since start of June.
However, a confirmation of the bull run would occur, if Bitcoin price produces a weekly candlestick close above $52,000.
Author

Akash Girimath
FXStreet
Akash Girimath is a Mechanical Engineer interested in the chaos of the financial markets. Trying to make sense of this convoluted yet fascinating space, he switched his engineering job to become a crypto reporter and analyst.


