Virtuals Protocol Price Forecast: VIRTUAL dips below $1.50 as profit-taking intensifies
- Virtuals Protocol trims intraday gains, sliding below $1.50 on Monday as investors book profits.
- Retail interest in VIRTUAL surges with futures Open Interest rising to $190 million, the highest since early August.
- Traders increase their risk exposure, piling into long positions despite the RSI retreating from overbought territory.

Virtuals Protocol (VIRTUAL) slides below $1.50 at the time of writing on Monday as bulls struggle to sustain a massive 20% price increase over the past 24 hours, according to CoinGecko.
Virtuals dips amid increasing retail demand
Virtuals Protocol is trading at the highest level since mid-August, supported by a significant increase in retail demand. According to CoinGlass data, VIRTUAL's futures Open Interest (OI) has exploded to approximately $190 million, the highest level since early August.
The surge occurred amid a broad bullish weekend, during which Bitcoin (BTC) rallied above $115,000. Altcoins, including Ethereum (ETH) and Ripple (XRP), extended their recovery, suggesting risk-on sentiment as the 'Uptober' spirit returns.
OI refers to the notional value of outstanding futures contracts. As VIRTUAL's OI increases, it shows that traders' interest is improving. In other words, investors are confident the token will maintain a bullish outlook in the short term.
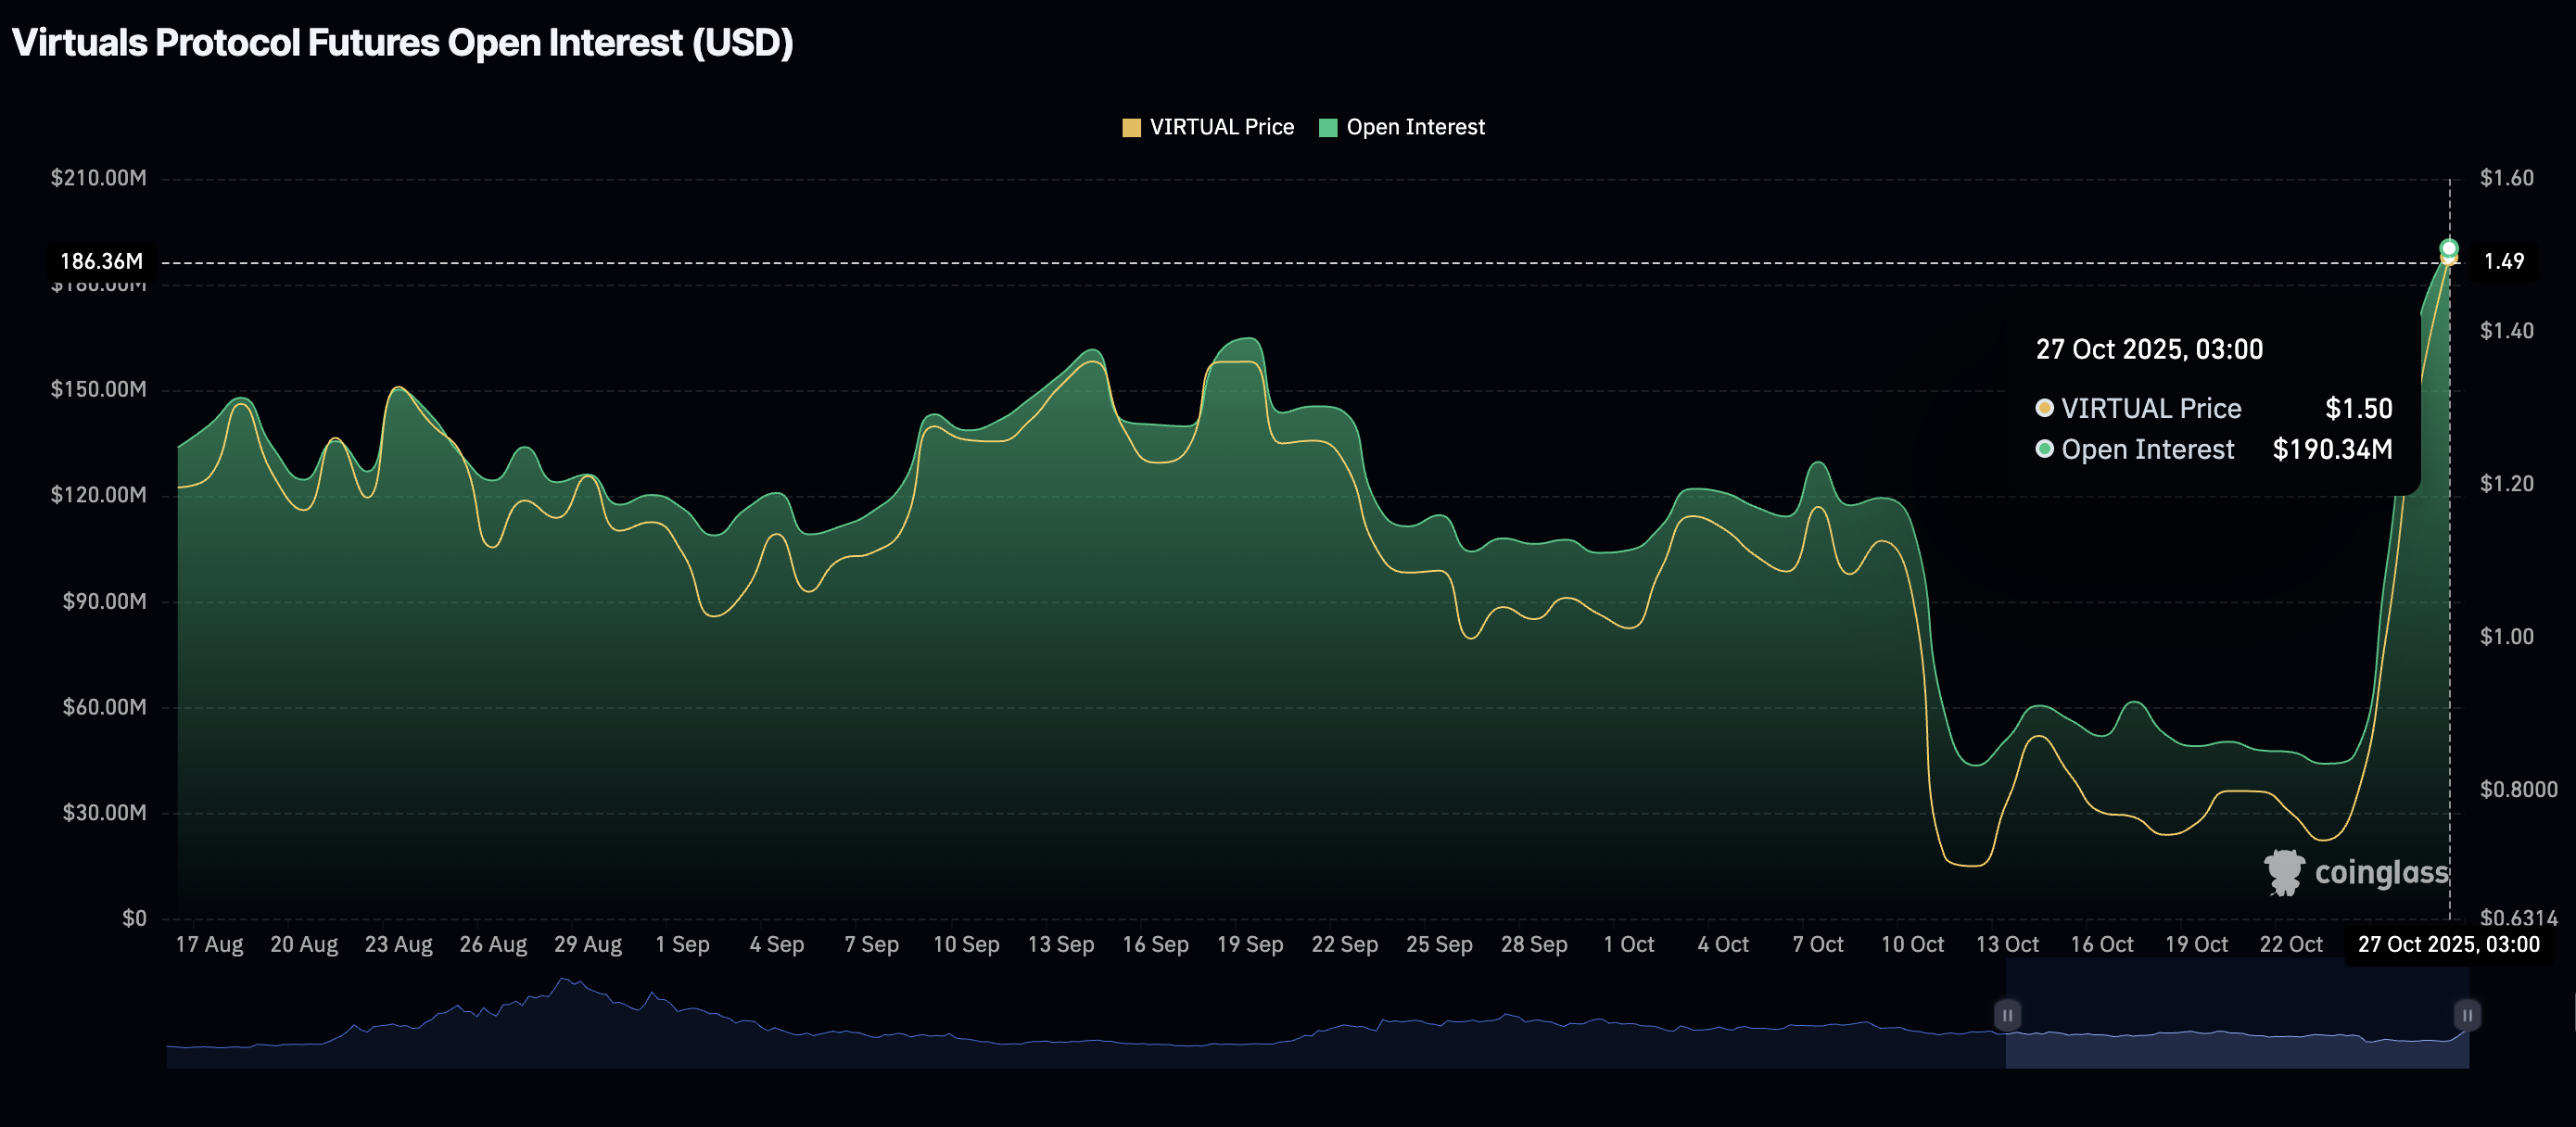
Virtuals Protocol Futures Open Interest | Source: CoinGlass
Traders are increasingly seeking risk exposure, as reflected in the OI-weighted funding rate, which flipped positive on Monday, averaging 0.0049% from -0.0631% on Sunday and -0.2483% on October 11.
A sustained increase signals that traders are confident about rejoining the market, piling into long positions, which strengthens the token's short-term bullish picture.
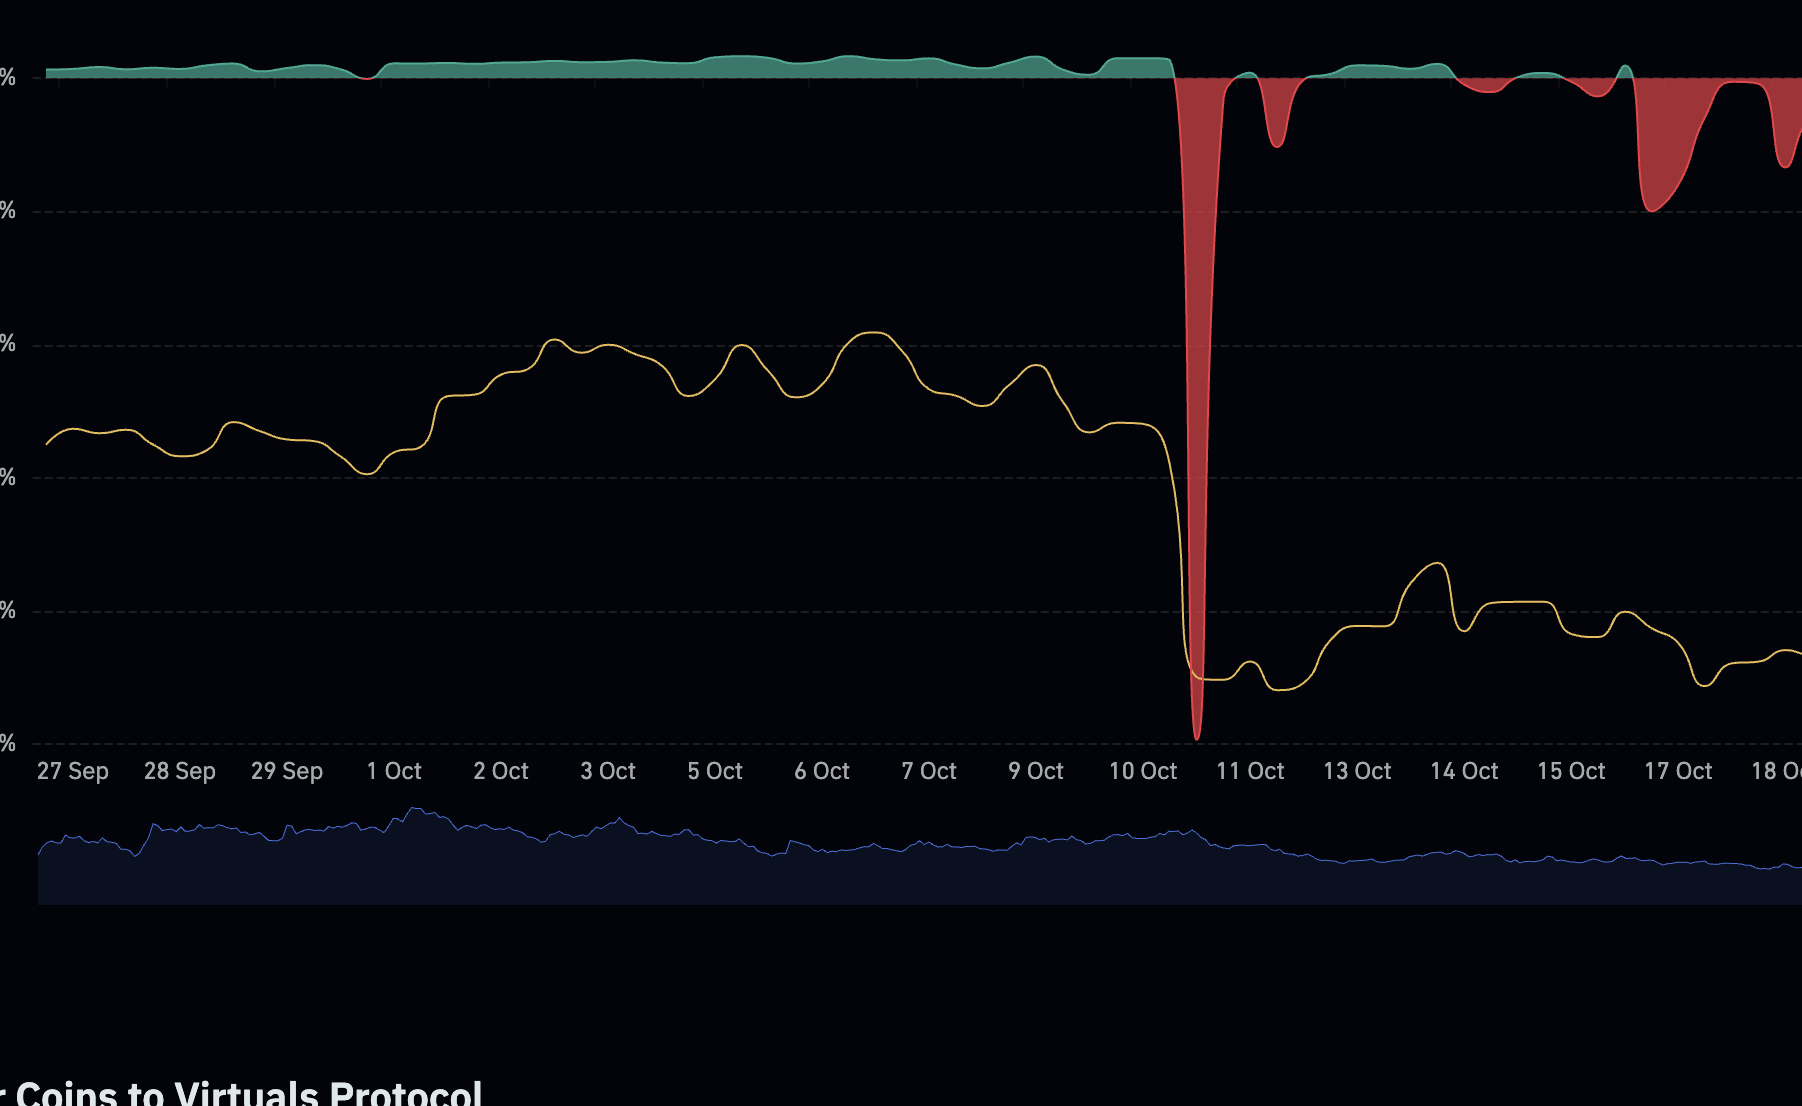
Virtuals Protocol Future OI-Weighted Funding Rate | Source: CoinGlass
Technical outlook: Can VIRTUAL resume its uptrend?
Virtuals Protocol corrects after four consecutive days of steady gains at the time of writing on Monday. The token, trading around $1.45, is down over 3.5% amid profit-taking.
The Relative Strength Index (RSI) is descending to 70 on the daily chart, indicating that bullish momentum is slowly easing. Lower RSI readings toward the midline could signal a longer correction.
Traders must not lose sight of the 200-day Exponential Moving Average (EMA) at $1.25, the 100-day EMA at $1.16 and the 50-day EMA at $1.05, all of which could serve as support levels if VIRTUAL's price correction continues.
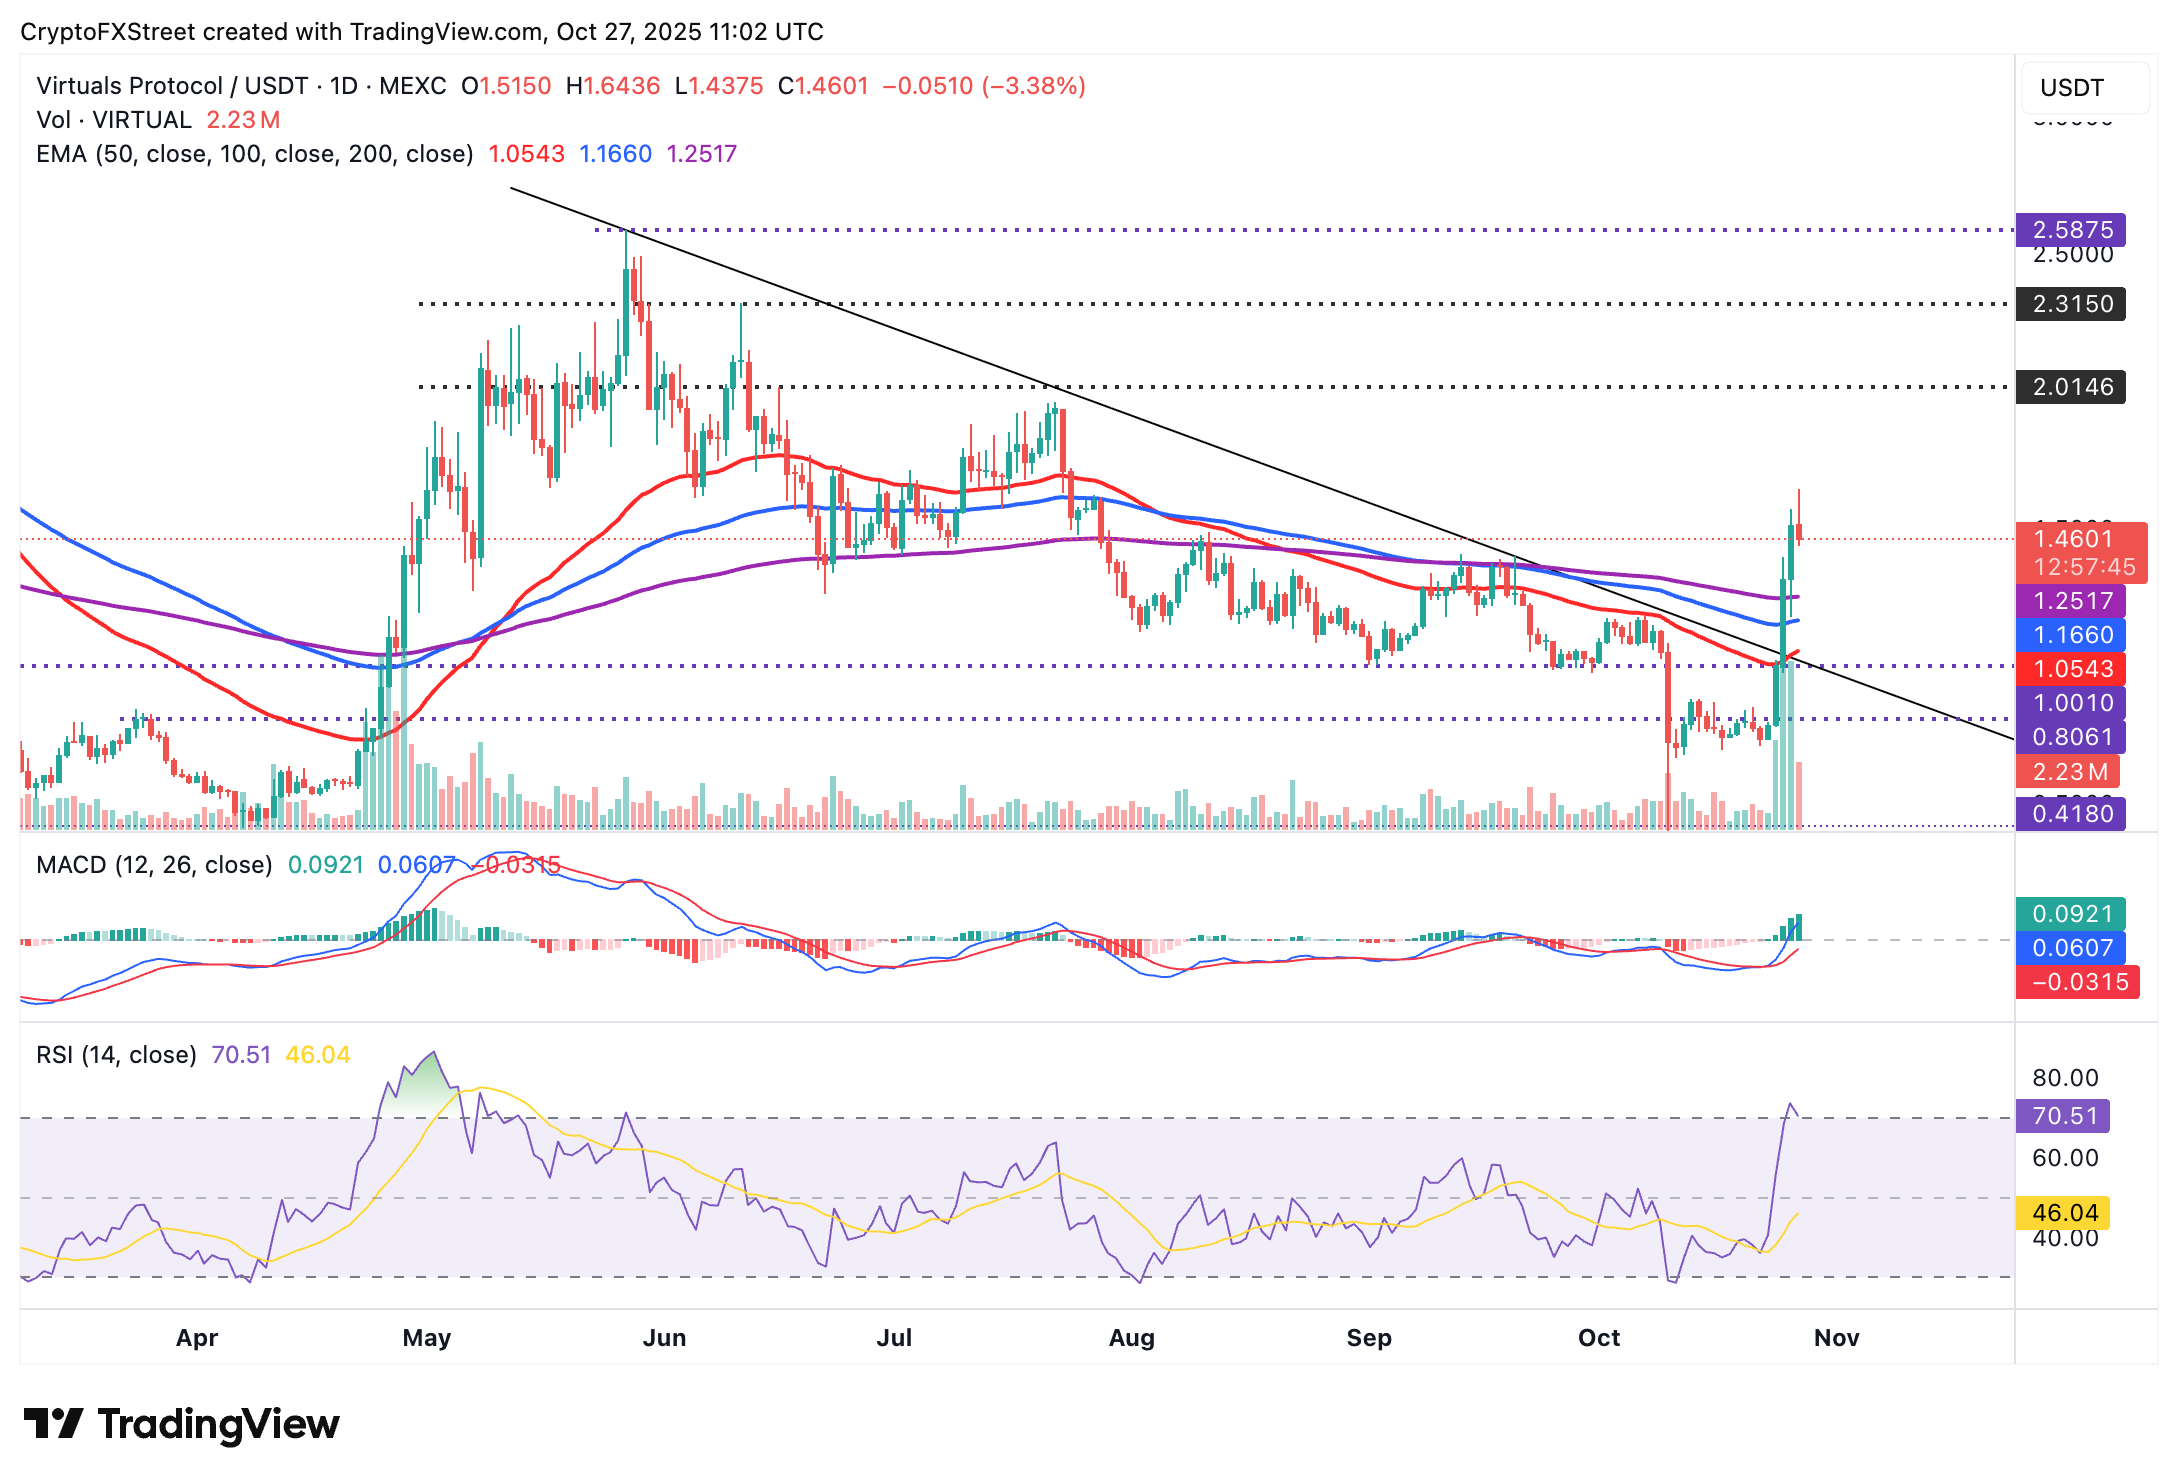
VIRTUAL/USDT daily chart
Still, the Moving Average Convergence Divergence (MACD) indicator on the same daily chart has upheld a buy signal since Friday. If the blue line remains above the red signal line, investors will continue to line up bullishly and increase risk exposure. Therefore, a daily close above $1.50 would uphold VIRTUAL's short-term bullish picture, increasing the chances of a breakout toward $2.00.
Open Interest, funding rate FAQs
Higher Open Interest is associated with higher liquidity and new capital inflow to the market. This is considered the equivalent of increase in efficiency and the ongoing trend continues. When Open Interest decreases, it is considered a sign of liquidation in the market, investors are leaving and the overall demand for an asset is on a decline, fueling a bearish sentiment among investors.
Funding fees bridge the difference between spot prices and prices of futures contracts of an asset by increasing liquidation risks faced by traders. A consistently high and positive funding rate implies there is a bullish sentiment among market participants and there is an expectation of a price hike. A consistently negative funding rate for an asset implies a bearish sentiment, indicating that traders expect the cryptocurrency’s price to fall and a bearish trend reversal is likely to occur.
Author

John Isige
FXStreet
John Isige is a seasoned cryptocurrency journalist and markets analyst committed to delivering high-quality, actionable insights tailored to traders, investors, and crypto enthusiasts. He enjoys deep dives into emerging Web3 tren


