- Vechain price is contained inside an ascending triangle pattern on the 12-hour chart.
- The pattern continues tightening closer to a breakout or breakdown.
After hitting a high of $0.0188 on November 25, Vechain has been stuck trading sideways, consolidating. Despite the recent bullish momentum of the cryptocurrency market, Vechain price still awaits a clear breakout or breakdown.
Vechain price is poised for a massive 25% move
Vechain price is currently trading at $0.0169 inside an ascending triangle pattern on the 12-hour chart. The digital asset is right in the middle of the pattern and needs to hold the 50-SMA for the bulls to remain in control.
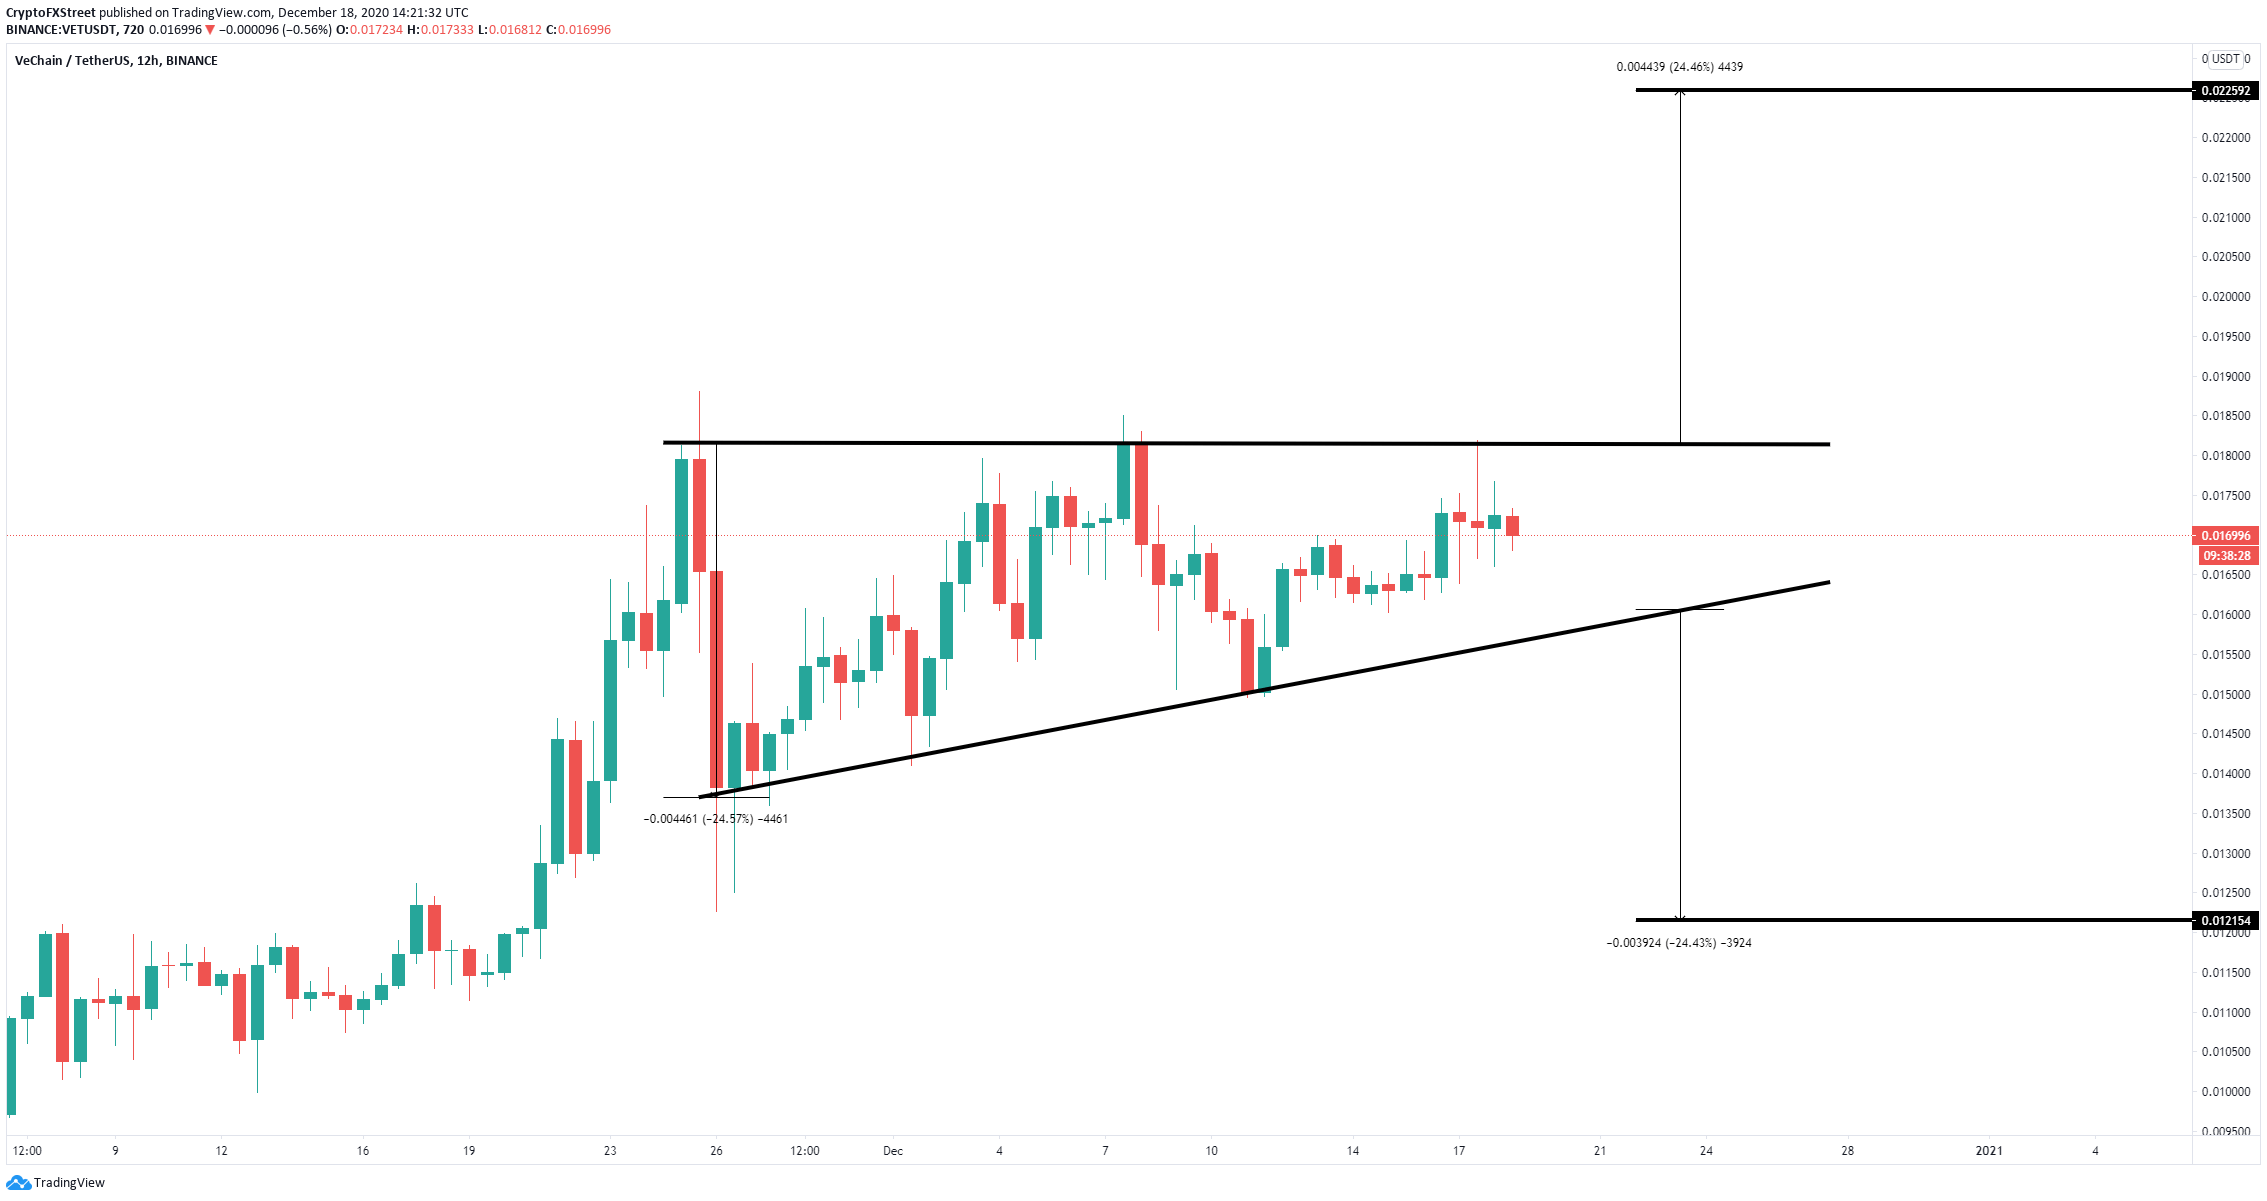
VET/USD 12-hour chart
A rebound from the 50-SMA at $0.0162 can easily push Vechain price towards the upper trendline of the pattern at $0.018. A further breakout above this point would finally drive the digital asset towards a high of $0.0225, a 25% move.
However, the failure to hold on to the 50-SMA would be a clear bearish sign and likely to push Vechain towards the lower boundary of the pattern at $0.0157. A breakdown below this point will force the digital asset to a low of $0.012.
Note: All information on this page is subject to change. The use of this website constitutes acceptance of our user agreement. Please read our privacy policy and legal disclaimer. Opinions expressed at FXstreet.com are those of the individual authors and do not necessarily represent the opinion of FXstreet.com or its management. Risk Disclosure: Trading foreign exchange on margin carries a high level of risk, and may not be suitable for all investors. The high degree of leverage can work against you as well as for you. Before deciding to invest in foreign exchange you should carefully consider your investment objectives, level of experience, and risk appetite. The possibility exists that you could sustain a loss of some or all of your initial investment and therefore you should not invest money that you cannot afford to lose. You should be aware of all the risks associated with foreign exchange trading, and seek advice from an independent financial advisor if you have any doubts.
Recommended Content
Editors’ Picks
Ripple's move above this key level could trigger nearly 50% rally for XRP
Ripple has overcome a critical resistance level and flipped into a support floor on the weekly time frame. This development happened while XRP tightly consolidated for roughly 250 days. Investors can expect XRP to kickstart a massive rally.
Optimism price outlook with nearly $90 million worth of OP tokens flooding markets on Friday
Optimism volatility has shrunk in the ours leading to the network’s cliff unlock. It joins the likes of dYdX and Sui, which have similar events on their calendars. As token unlocks are often considered bearish catalysts, investors should brace for a reaction after the event.
Top 3 Price Prediction Bitcoin, Ethereum, Ripple: Retail watches from the sidelines with a bias for shorts
Bitcoin could clear $73,777 peak as BTC bulls resurface. Ethereum might fall 10% before next leg up as ETH RSI teases with sell signal. XRP could lose $0.6000 threshold as Ripple bulls fail to show up.
Jito price could hit $6 as JTO coils up inside this bullish pattern
Jito price action shows a potential cup and handle formation. Based on theoretical measurement rules, a successful breakout could yield a 56% rally to $6.0. A breakdown of the $3.86 support level would create a lower low for JTO and invalidate the bullish thesis.
Bitcoin: BTC may have recovered, but is it out of the woods?
Bitcoin’s (BTC) upward momentum has shown a significant decline for the past two weeks or so. This development led to a bearish signal on the weekly and an uncertain outlook on the monthly.