VeChain Price Prediction: VET set to decline another 30%
- VeChain price respecting the 10-week simple moving average (SMA) during staircase advance.
- 3.618 Fibonacci extension level halted the bull market.
- 330% gain from cup-with-handle breakout on January 4.

Vechain price has stalled for two weeks at the 3.618 Fibonacci extension level of the 2018-2020 bear market after climbing 106% above the 10-week SMA. During the bull market, VET has reached similar deviations in January and February before correcting to around the 0.618 Fibonacci retracement level of the prior advance, which coincided with the moving average. Based on historical precedent, VET could fall to at least $0.059 and then $0.053.
VeChain price to test bulls over the next 2-3 weeks
It is not often that a financial market or instrument follows a symmetrical path during an advance, but there has been interesting symmetry in the case of VET. First, beginning in late December 2020, each leg higher has corrected to close to the 0.618 Fibonacci retracement level. Second, each correction discovered support at the 10-week SMA. Third, each leg higher peaked over 100% above the moving average. With such symmetrical guideposts, it becomes easier to project the outlook for VeChain price moving forward.
Utilizing the criteria above, VeChain price should correct at least another 27% from the current price to touch the 0.618 Fibonacci retracement level of the last leg higher. If the level does not hold, VET should discover notable support at the 10-week SMA, 35% from current price levels. It would be a good risk level for traders to initiate a new long position.
The decline should last 3-4 weeks before the resumption of the decisive advance.
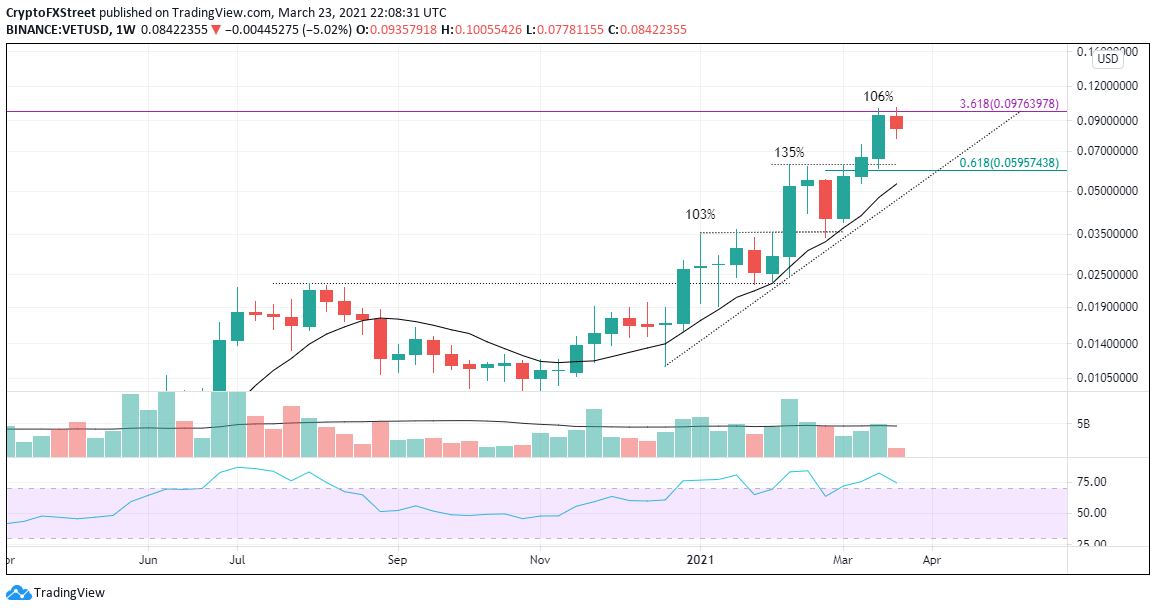
VET/USD weekly chart
Of course, a failure to strike support at the 10-week SMA would put the long-term bullish outlook on hold. This would then shift the focus to the trendline beginning at the December 2020 low, which currently rests at $0.047. The next support doesn’t come into view until $0.035.
Author

Sheldon McIntyre, CMT
Independent Analyst
Sheldon has 24 years of investment experience holding various positions in companies based in the United States and Chile. His core competencies include BRIC and G-10 equity markets, swing and position trading and technical analysis.


