VeChain Price Prediction: VET primed for its last leg up of a 220% bull rally
- VeChain price hints at an explosive last phase if it slices through the $0.085 barrier.
- The resulting breakout will be a 28% upswing that puts VET at $0.11.
- The Momentum Reversal Indicator’s (MRI) breakout line at $0.10 could deter this uptrend.

VeChain price shows signs of continuing its stellar momentum as it approaches the end of a 220% bull rally.
VeChain price aims higher
VeChain price has appreciated over 40% in the last week as it hovers around $0.08. Interestingly, this zone coincides with the 100% Fibonacci retracement level, and breaching it could trigger the final 28% ascent.
From late December 2020 to-date, VeChain price has been on a constant bull rally with higher highs and higher lows, creating an ascending parallel channel.
The recent tap at the lower trendline of this setup was seen on February 28. Since this bounce, VET bulls have pushed the price up by 145% to $0.080. Hence, VET's market value needs to appreciate by another 28% to hit its intended target at $0.11, coinciding with the 127.2% Fibonacci retracement level.
Nonetheless, the MRI’s breakout line at $0.10 could be a double-edged sword that could affect the rally. If bulls conquer it, VeChain has a high likelihood of continuing its ascent. Else, the altcoin could tumble.
Therefore, a spike in buying pressure, leading to a decisive daily candlestick close above this barrier, is crucial.
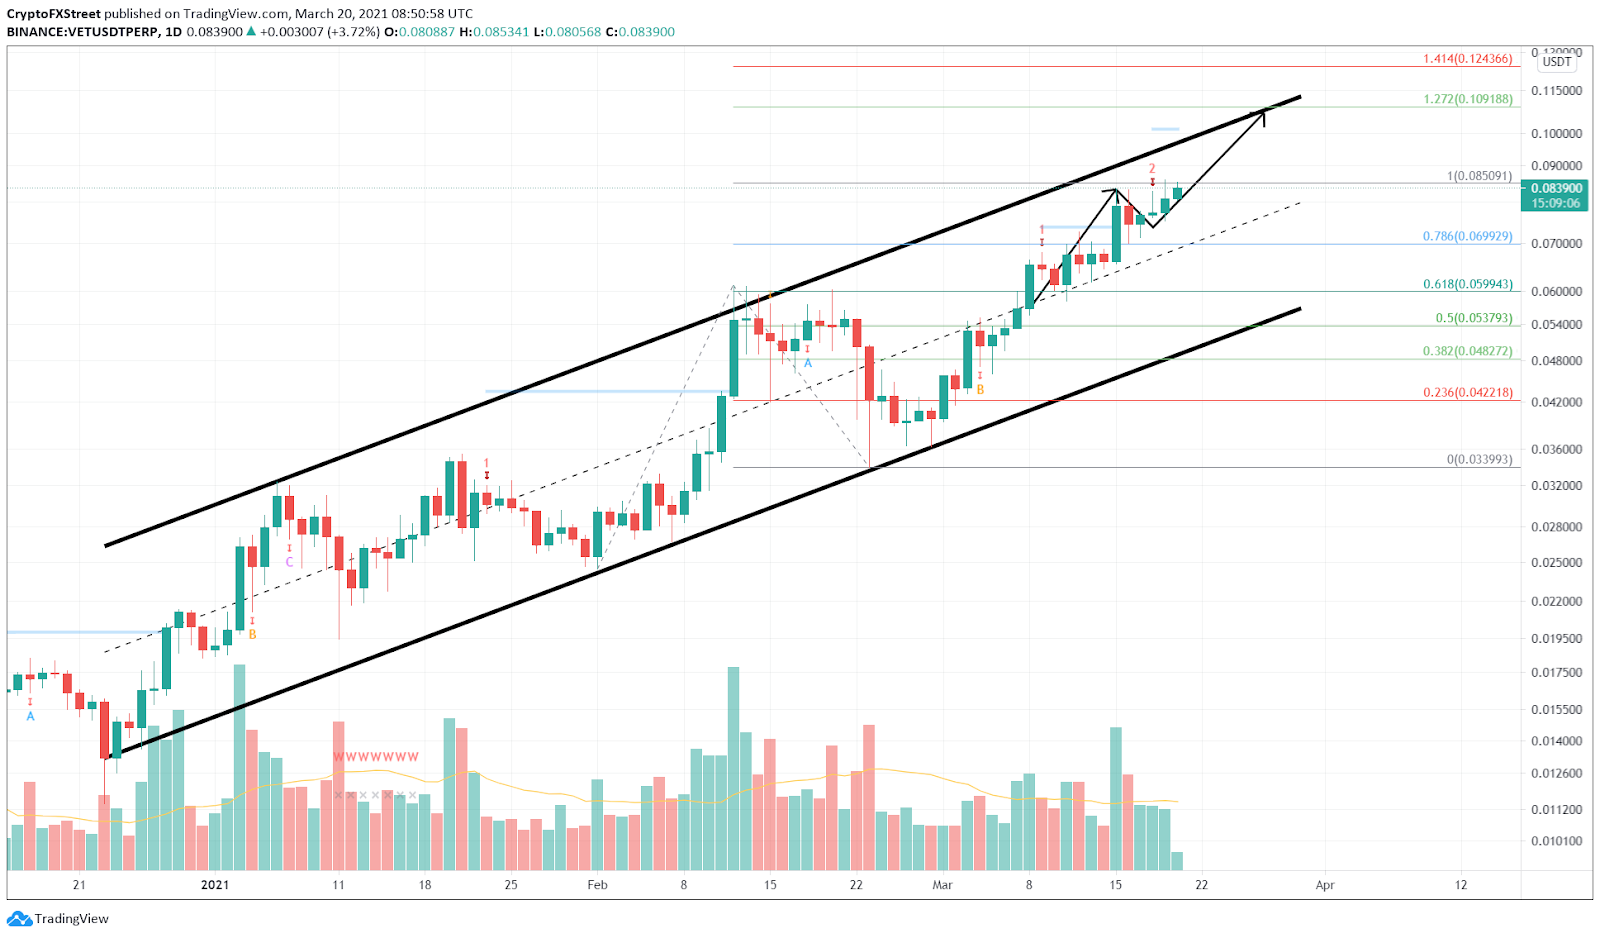
VET/USDT 1-day chart
However, investors need to note that the MRI indicator has flashed not one but two “cycle top” signals and suggest that the rally is overextended.
So, if VET drops below 78.6% Fibonacci retracement level at $0.069, it could invalidate the bullish outlook. In such a scenario, VeChain price could continue its descent to 61.8% Fibonacci retracement level at $0.059.
Author

Akash Girimath
FXStreet
Akash Girimath is a Mechanical Engineer interested in the chaos of the financial markets. Trying to make sense of this convoluted yet fascinating space, he switched his engineering job to become a crypto reporter and analyst.


