- VeChain uptrend is still in jeopardy, especially with overhead pressure surging under the 100 SMA.
- If descending parallel channel’s middle-boundary support is shattered, a breakdown will likely extend to $0.024.
- VET opportunity to avert the breakdown lies with defending support at the 50 SMA and the 100 SMA.
VeChain has generally sustained a downtrend for over two weeks and there is no sign of recovery. Its upside seems strongly barricaded, limiting price movement. On the downside, bulls are in the middle of a fierce fight to secure higher support. However, a massive breakdown still looms in the direction of $0.024.
VeChain is on the verge of another breakdown
The VET 4-hour chart brings to light the formation of a descending parallel channel. This pattern began forming after VeChain hit a barrier at $0.035 in January. Recovery attempts have been rendered unsuccessful, with losses testing $0.024.
For instance, the most recent attempt to reverse the trend lost steam at the 100 Simple Moving Average, a resistance reinforced by the channel’s upper boundary. Currently, a retreat is underway with VET struggling to balance at the 50 SMA and 200 SMA confluence.
Realize that losing control over this support will put more pressure on the ascending parallel channel’s middle boundary. Besides, if VeChain slices through this critical zone, a massive breakdown would ensue. Support at $0.024 may come in handy to stop the losses, but VET’s downtrend could be unstoppable until it meets the buyer congestion area at $0.02.
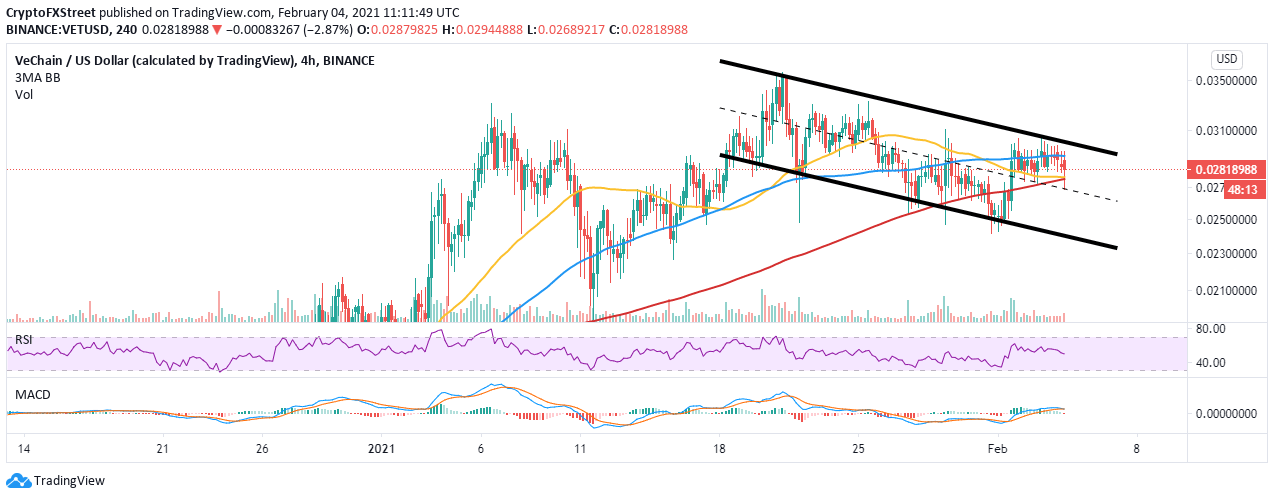
VET/USD 4-hour chart
The Moving Average Convergence Divergence or MACD on the same 4-hour chart emphasizes the bearish outlook. While the MACD (blue line) is in the positive region, it is about to cross under the signal line, a bearish signal and a call to sell. Moreover, the Relative Strength Index shows that selling pressure is getting stronger.
Looking at the other side of the fence
VeChain has a couple of key areas to hold onto to avert the potential breakdown and these are the ascending parallel channel’s middle boundary and the confluence formed by the 50 SMA and the 200 SMA.
Another bullish signal would be making a daily close above the 100 SMA. Such price action may trigger more orders to create enough tailwind behind VET for gains toward $0.035.
Information on these pages contains forward-looking statements that involve risks and uncertainties. Markets and instruments profiled on this page are for informational purposes only and should not in any way come across as a recommendation to buy or sell in these assets. You should do your own thorough research before making any investment decisions. FXStreet does not in any way guarantee that this information is free from mistakes, errors, or material misstatements. It also does not guarantee that this information is of a timely nature. Investing in Open Markets involves a great deal of risk, including the loss of all or a portion of your investment, as well as emotional distress. All risks, losses and costs associated with investing, including total loss of principal, are your responsibility. The views and opinions expressed in this article are those of the authors and do not necessarily reflect the official policy or position of FXStreet nor its advertisers. The author will not be held responsible for information that is found at the end of links posted on this page.
If not otherwise explicitly mentioned in the body of the article, at the time of writing, the author has no position in any stock mentioned in this article and no business relationship with any company mentioned. The author has not received compensation for writing this article, other than from FXStreet.
FXStreet and the author do not provide personalized recommendations. The author makes no representations as to the accuracy, completeness, or suitability of this information. FXStreet and the author will not be liable for any errors, omissions or any losses, injuries or damages arising from this information and its display or use. Errors and omissions excepted.
The author and FXStreet are not registered investment advisors and nothing in this article is intended to be investment advice.
Recommended Content
Editors’ Picks
Ripple's move above this key level could trigger nearly 50% rally for XRP
Ripple has overcome a critical resistance level and flipped into a support floor on the weekly time frame. This development happened while XRP tightly consolidated for roughly 250 days. Investors can expect XRP to kickstart a massive rally.
Optimism price outlook with nearly $90 million worth of OP tokens flooding markets on Friday
Optimism volatility has shrunk in the ours leading to the network’s cliff unlock. It joins the likes of dYdX and Sui, which have similar events on their calendars. As token unlocks are often considered bearish catalysts, investors should brace for a reaction after the event.
Top 3 Price Prediction Bitcoin, Ethereum, Ripple: Retail watches from the sidelines with a bias for shorts
Bitcoin could clear $73,777 peak as BTC bulls resurface. Ethereum might fall 10% before next leg up as ETH RSI teases with sell signal. XRP could lose $0.6000 threshold as Ripple bulls fail to show up.
Jito price could hit $6 as JTO coils up inside this bullish pattern
Jito price action shows a potential cup and handle formation. Based on theoretical measurement rules, a successful breakout could yield a 56% rally to $6.0. A breakdown of the $3.86 support level would create a lower low for JTO and invalidate the bullish thesis.
Bitcoin: BTC may have recovered, but is it out of the woods?
Bitcoin’s (BTC) upward momentum has shown a significant decline for the past two weeks or so. This development led to a bearish signal on the weekly and an uncertain outlook on the monthly.