VeChain Price Forecast: VET bearish outlook remains unchanged
- VeChain price decline finding support at the 100 four-hour simple moving average (SMA)
- Volume is contracting on rebounds and surging during descents.
- A descending channel developing on the 4-hour chart.

VeChain price is in the process of correcting the 330% gain from a cup-with-handle breakout on January 3. The overbought condition on the weekly chart and the bearish momentum divergence combined with the failure to overcome the 3.618 Fibonacci extension of the 2018-2020 bear market at $0.098 established the context for this emerging correction.
VeChain price now reflecting weak technicals
There has been no fundamental change in the longer-term charts to justify overturning the bearish outlook. VET will not overcome the critical Fibonacci extension level until the overbought condition has been released on the Relative Strength Index (RSI) and weak holders have been forced from the digital currency.
On March 22, VET broke the rising trendline from the February low on a surge of volume, and it was a warning that lower prices were in the pipeline. Prices continued to correct into yesterday, where VeChain price rebounded from the 100 four-hour SMA, but on well below-average volume. The same low volume profile accompanied the March 24 rebound from the 50 four-hour SMA.
The March 24 low was engineered by the intersection of the 100 four-hour SMA and the 0.382 retracement level of the March rally at $0.075, but expectations remain focused on a deeper correction. Look for instant support at the 0.50 retracement level at $0.067, a 30% decline from the all-time high. It is a significant loss but common in the VeChain price history.
If the selling is not contained, the 0.618 Fibonacci retracement level at $0.059 and the February high at $0.061 join in establishing formable support.
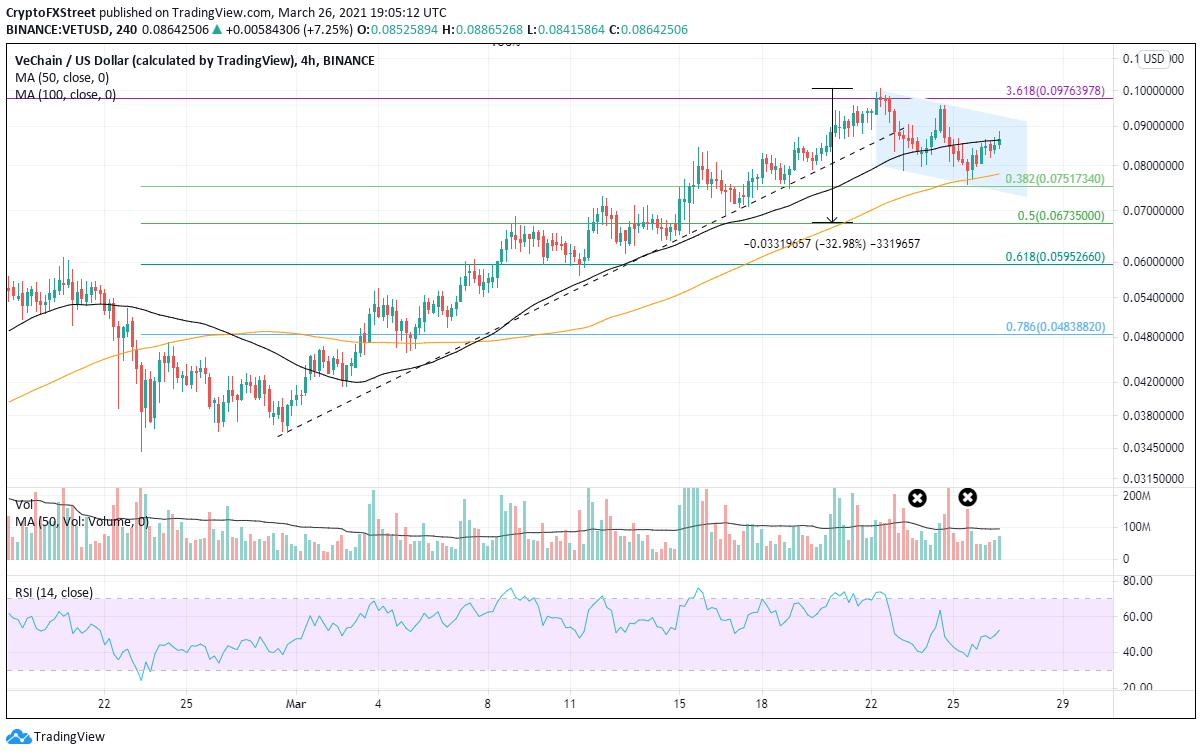
VET/USD 4-hour chart
Resistance levels begin at the 50 four-hour moving average at $0.086, followed by the descending channel’s upper trendline at $0.092. A close above $0.096 would trigger a double bottom formation and raise the odds that the correction is over and VET is ready to print new all-time highs.
Author

Sheldon McIntyre, CMT
Independent Analyst
Sheldon has 24 years of investment experience holding various positions in companies based in the United States and Chile. His core competencies include BRIC and G-10 equity markets, swing and position trading and technical analysis.


