|

Vechain price breaks out and targets a 43% surge towards $0.026

  • It seems that Vechain price broke out of an ascending triangle pattern on the 12-hour chart.
  • The long-term price target for the bulls is located at $0.026.

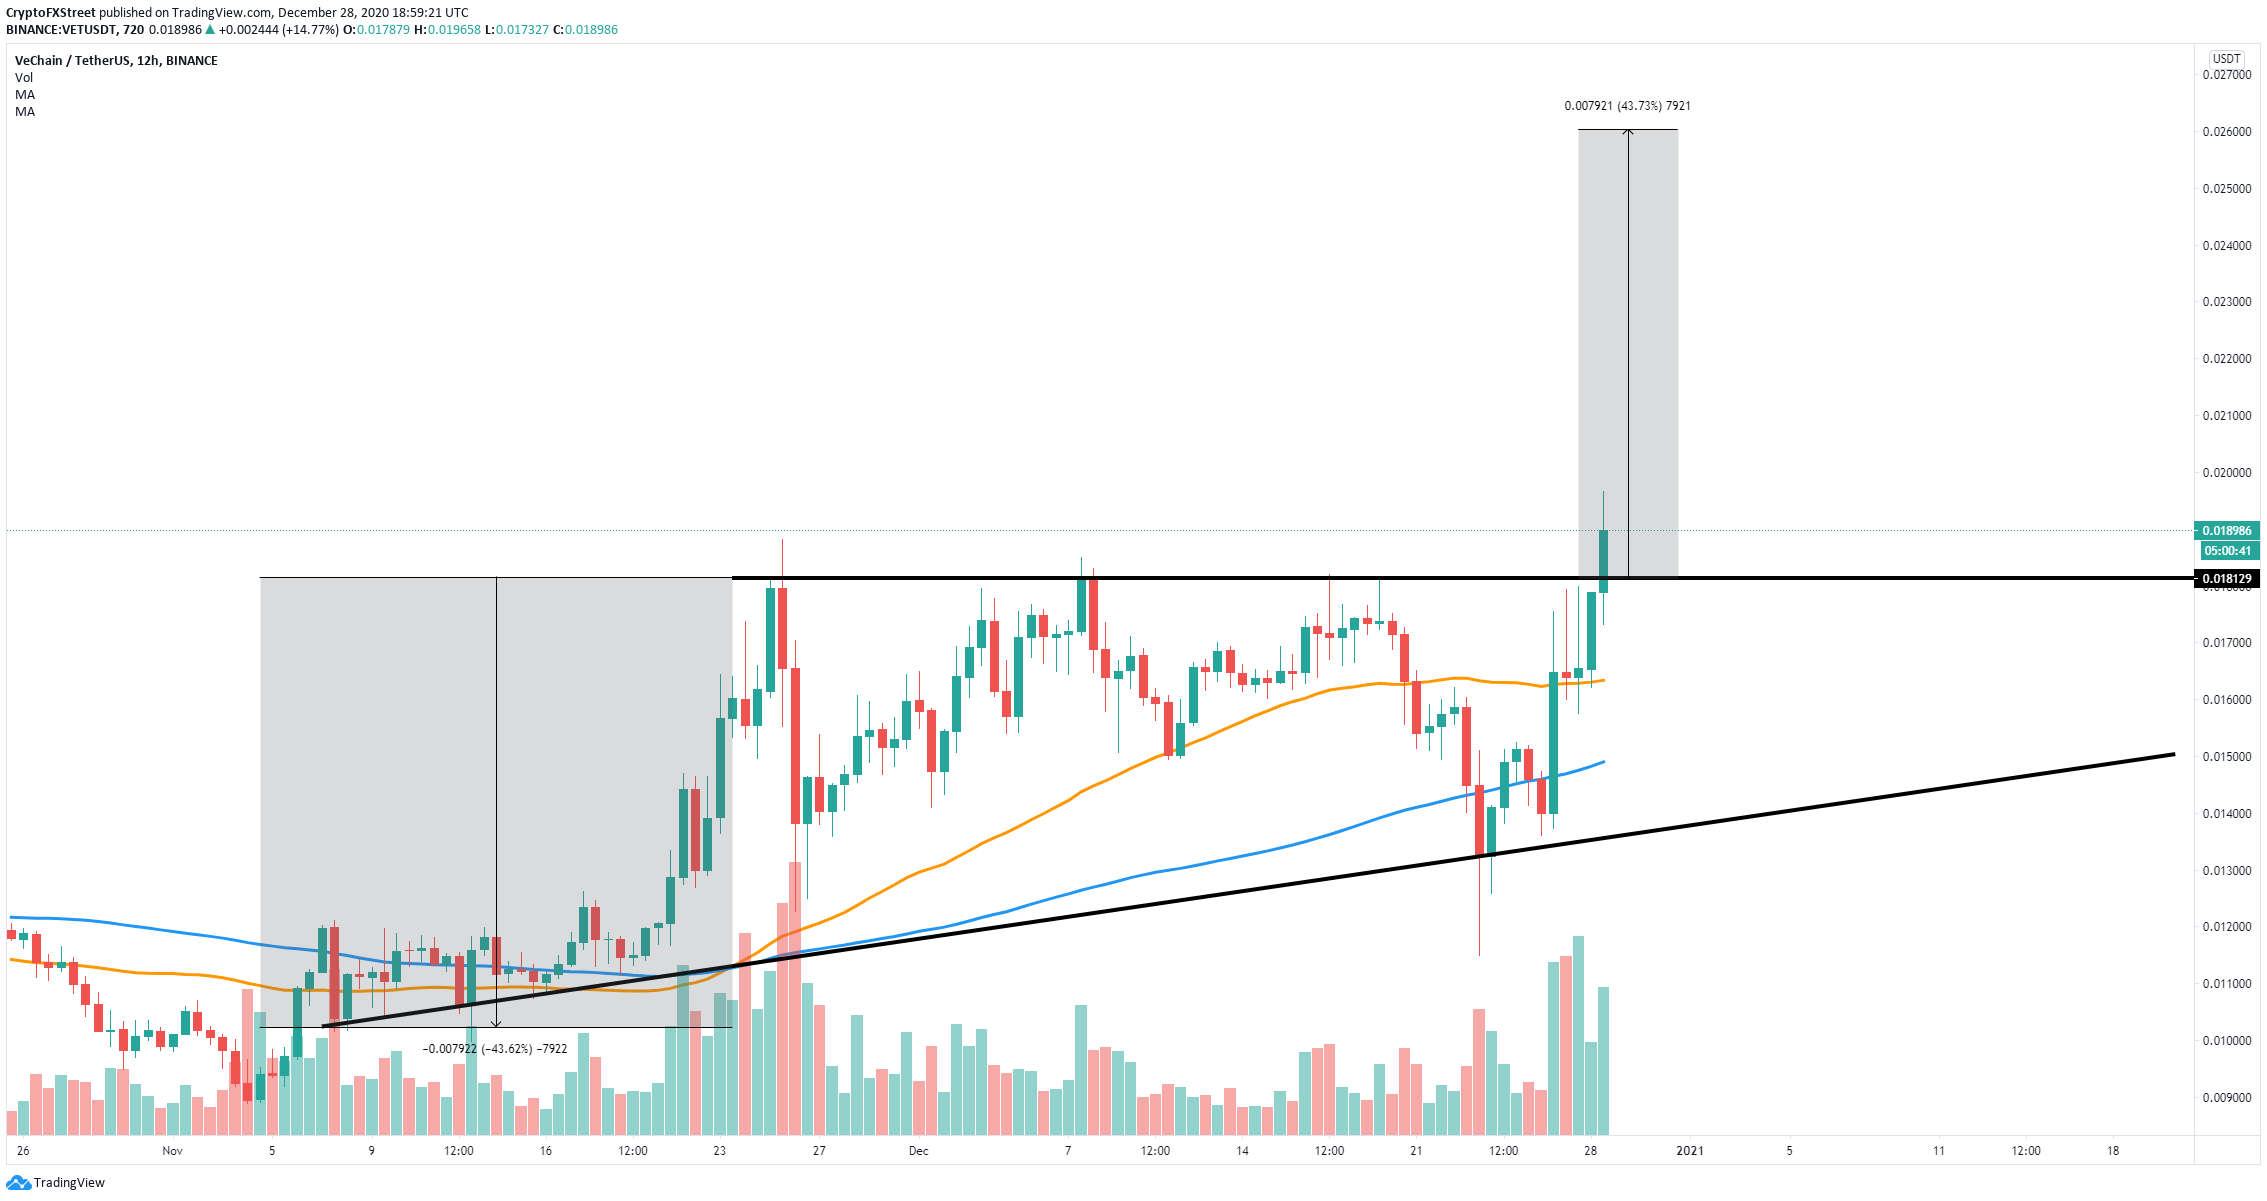
Vechain was trading inside a long-term ascending triangle pattern on the 12-hour chart from which it has broken out and now aims to hit a new 2020-high at $0.026. The digital asset faces very little resistance to the upside.

Vechain price looks strong and poised for a run to $0.026

On the 12-hour chart, Vechain bulls were able to push the digital asset above an ascending triangle pattern, cracking the critical resistance level at $0.018 decisively, with Vechain price hitting $0.0196. 
vet price

VET/USD 12-hour chart

Vechain has managed to conquer the 50-SMA and the 100-SMA and turn both into support levels. The breakout of the ascending triangle means that VET targets $0.026, a 43% move which can be calculated using the height of the pattern as a reference point.

The only potential bearish outlook for Vechain is a re-test of the broken resistance level at $0.018. Usually, after a breakout above a triangle pattern, the digital asset might come back down to re-test the previous resistance. 
vet price

VET/USD 12-hour chart

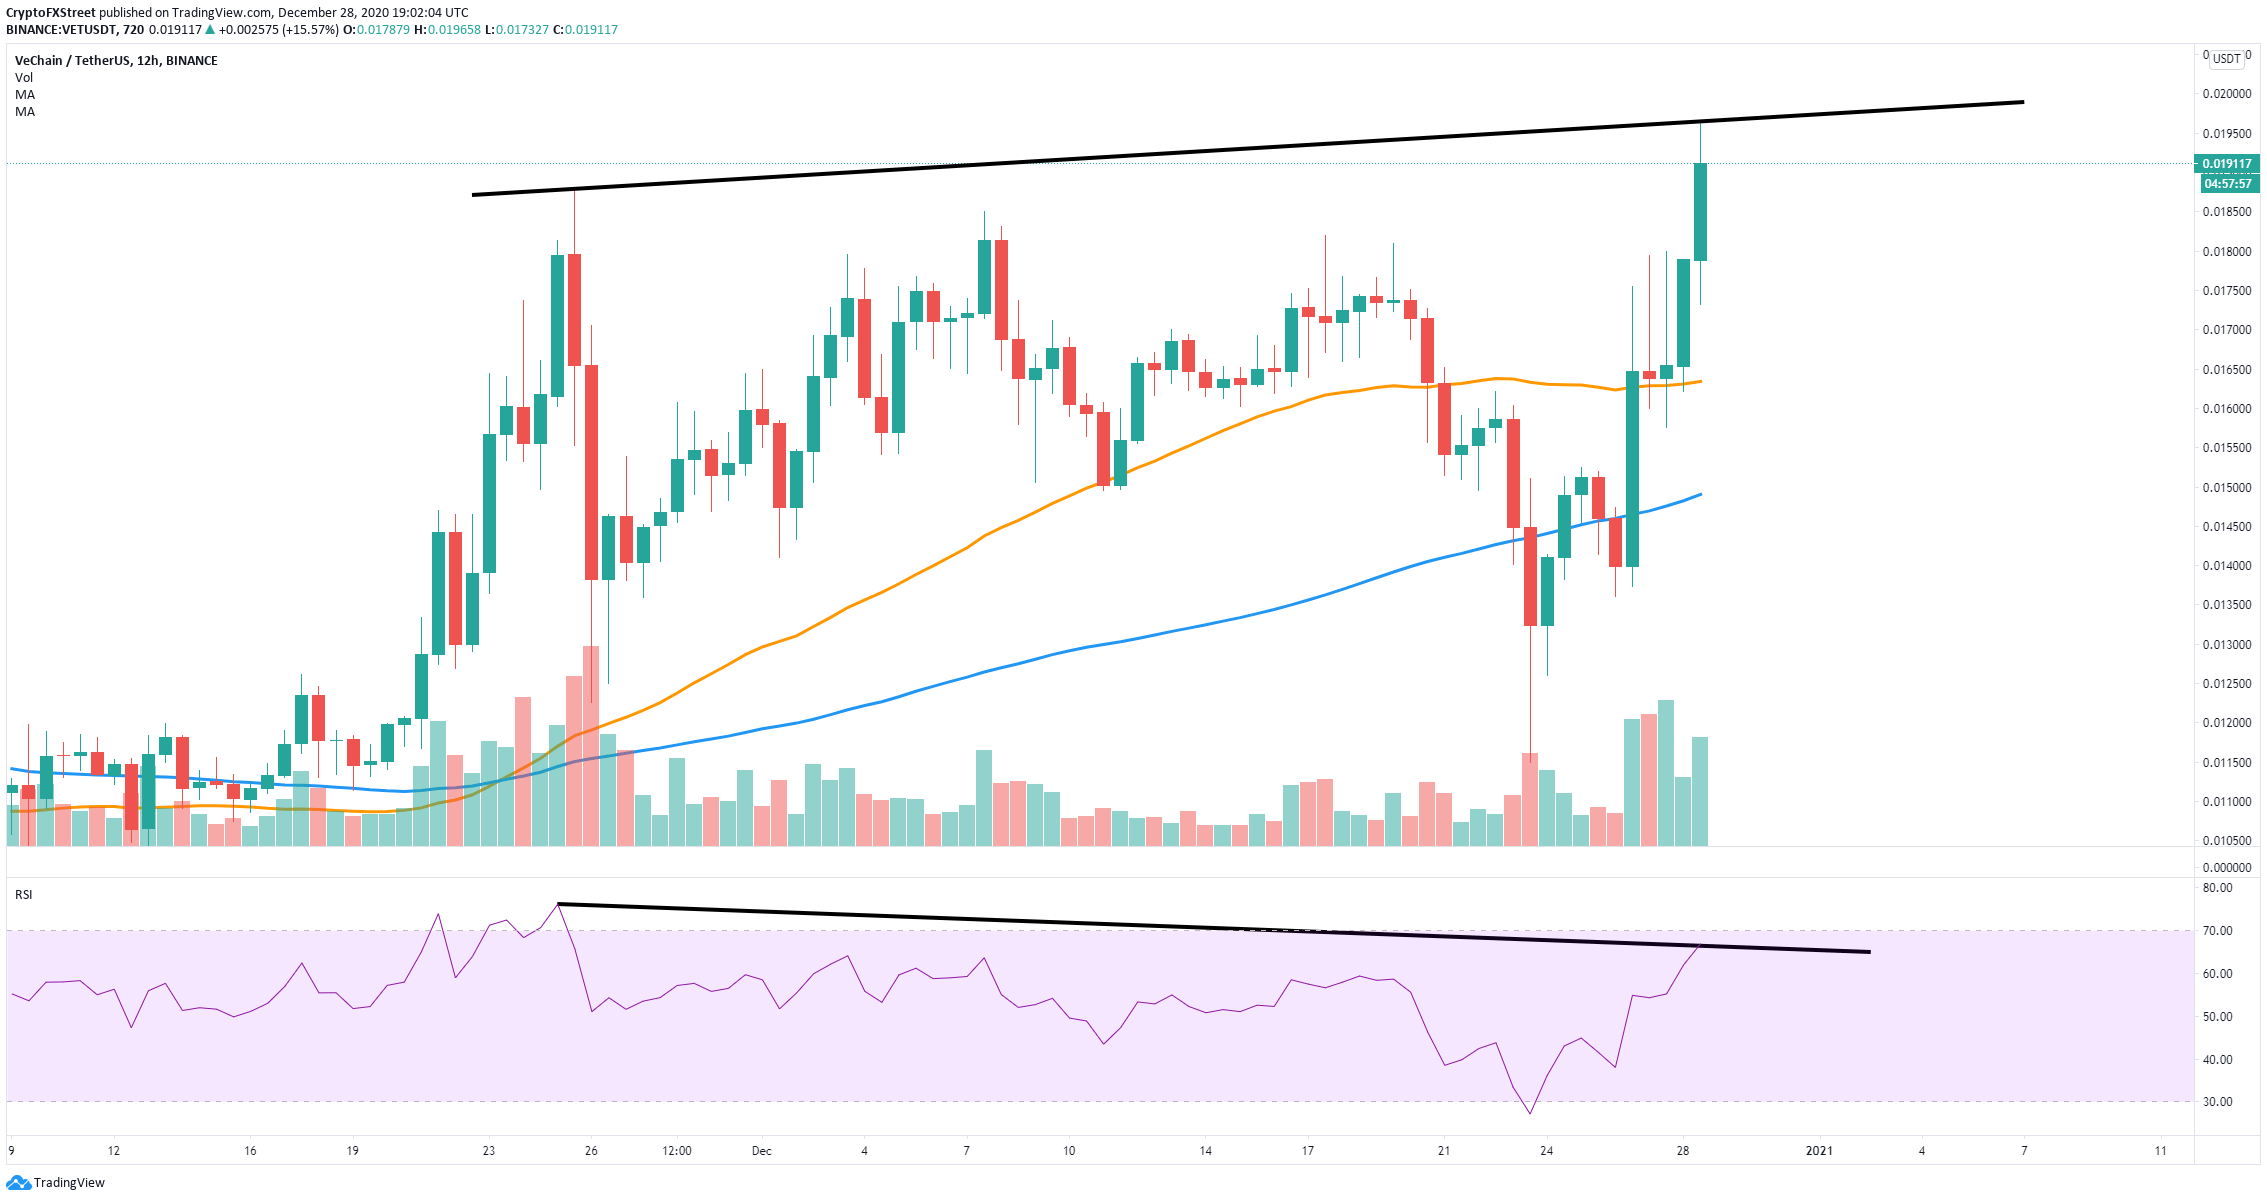
Additionally, there seems to be an RSI divergence with the price on the 12-hour chart as Vechain price has set higher highs, but the RSI established lower highs. This is considered bearish. The potential price target for bears would be the 50-SMA at $0.016. 

Author

Lorenzo Stroe

Lorenzo Stroe

Independent Analyst

Lorenzo is an experienced Technical Analyst and Content Writer who has been working in the cryptocurrency industry since 2012. He also has a passion for trading.


More from Lorenzo Stroe
Share:

Editor's Picks

XRP, ADA, and SOL are vulnerable to deeper losses

The top altcoins, including Ripple, Cardano and Solana, are trading in the red as the broader cryptocurrency market faces downside pressure. The bearish pressure aligns with Citadel Securities' anticipation of a surprise Fed rate hike, which could reduce liquidity in high-risk assets, including crypto assets.

XRP and XLM extend correction as bearish pressure builds

Ripple and Stellar remain under pressure on Tuesday after losing over 4% and over 5%, respectively, the previous day. In addition, weakening momentum indicators and deteriorating derivatives metrics suggest sellers remain in control, raising the risk of further downside for both altcoins. Derivatives data shows a slight bearish tilt.

Bitcoin risks losing $63,000 – FET, SHIB lead losses

Bitcoin edges lower on Tuesday, extending its losses of over 2% from the previous day. The broader crypto market suffered nearly $600 million in liquidations over the last 24 hours amid renewed sell-off pressure. Artificial Superintelligence Alliance and Shiba Inu have emerged as the worst-performing crypto assets in the same time period.

Pump.fun surges following rising revenue and social push
PUMP, the native crypto of token launchpad Pump.fun, saw double-digit gains on Monday, rising to nearly $0.00220, its highest level in about 11 weeks, before easing. The recent gains have stretched its 14- and 30-day performance above 38% and 50%, respectively.
Bitcoin: BTC holds firm, but the $100 Oil threat could change the game
Bitcoin (BTC) is modestly recovering, trading at $65,400 on Friday and holding firmly above the key support zone. US-listed spot Bitcoin Exchange Traded Funds (ETFs) supported BTC’s modest recovery as they continued to attract institutional inflows through Thursday, pointing to the third consecutive week of inflows.


