VeChain Price Analysis: On-chain metrics indicate VET facing no resistance until $0.017
- VeChain is currently trading at $0.0132 after a notable 23% drop on September 3.
- According to on-chain metrics, VET will encounter very little resistance until $0.017.

VeChain is currently trading at $0.0132, and it’s still up by more than 700% since the crash of March 12. Looking at the IOMAP chart, it’s abundantly clear that VeChain price has a clear path well until $0.017.
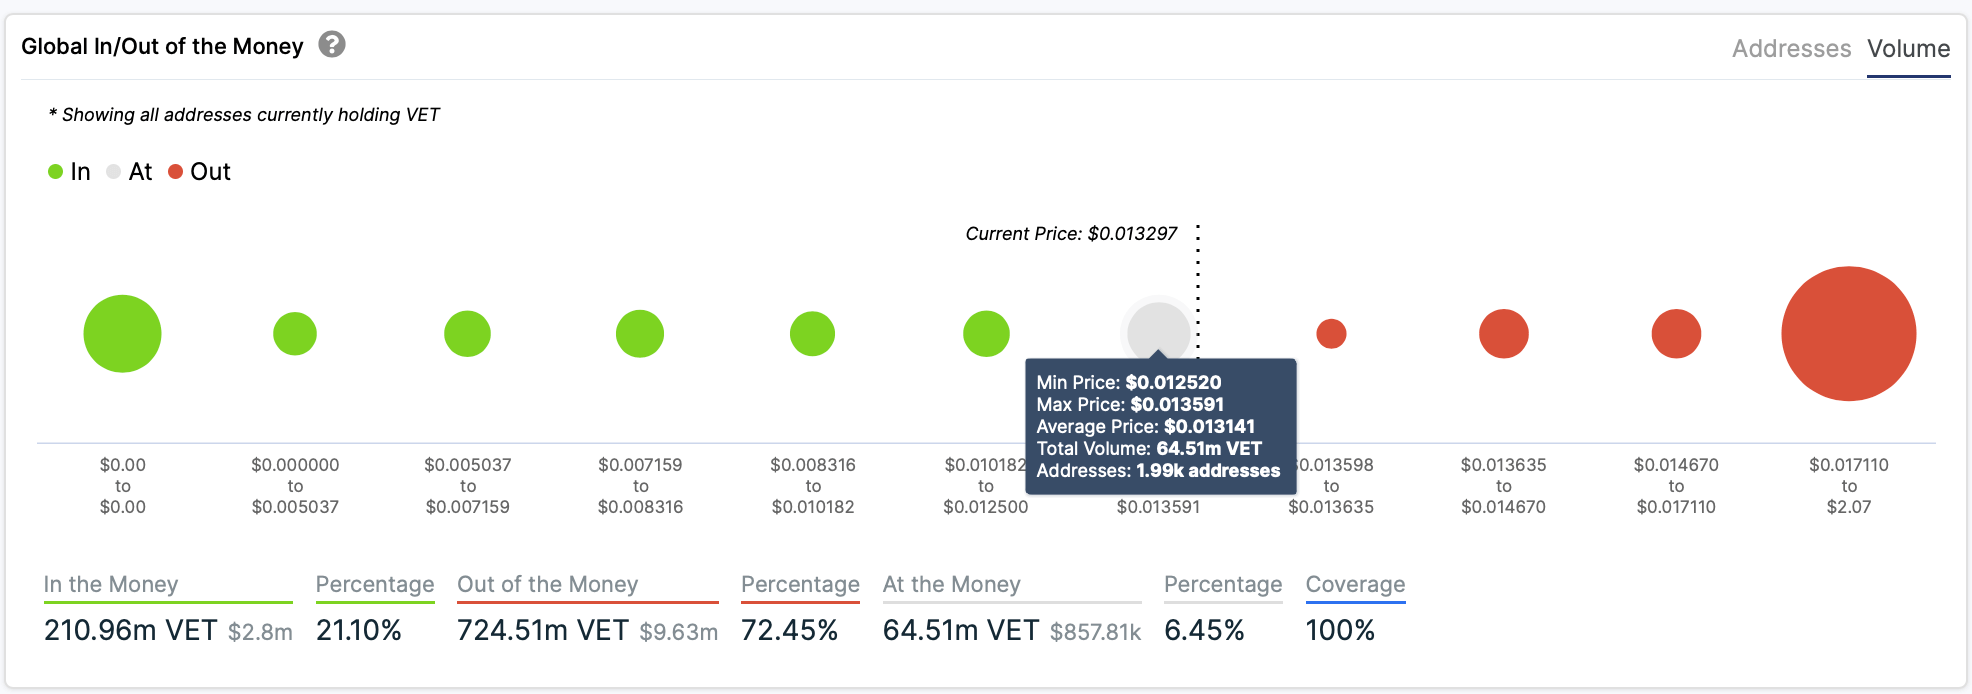
At the same time, support also seems to be quite slim, so we will need to look at other indicators to see if VET can climb towards $0.017.
VET/USD daily chart
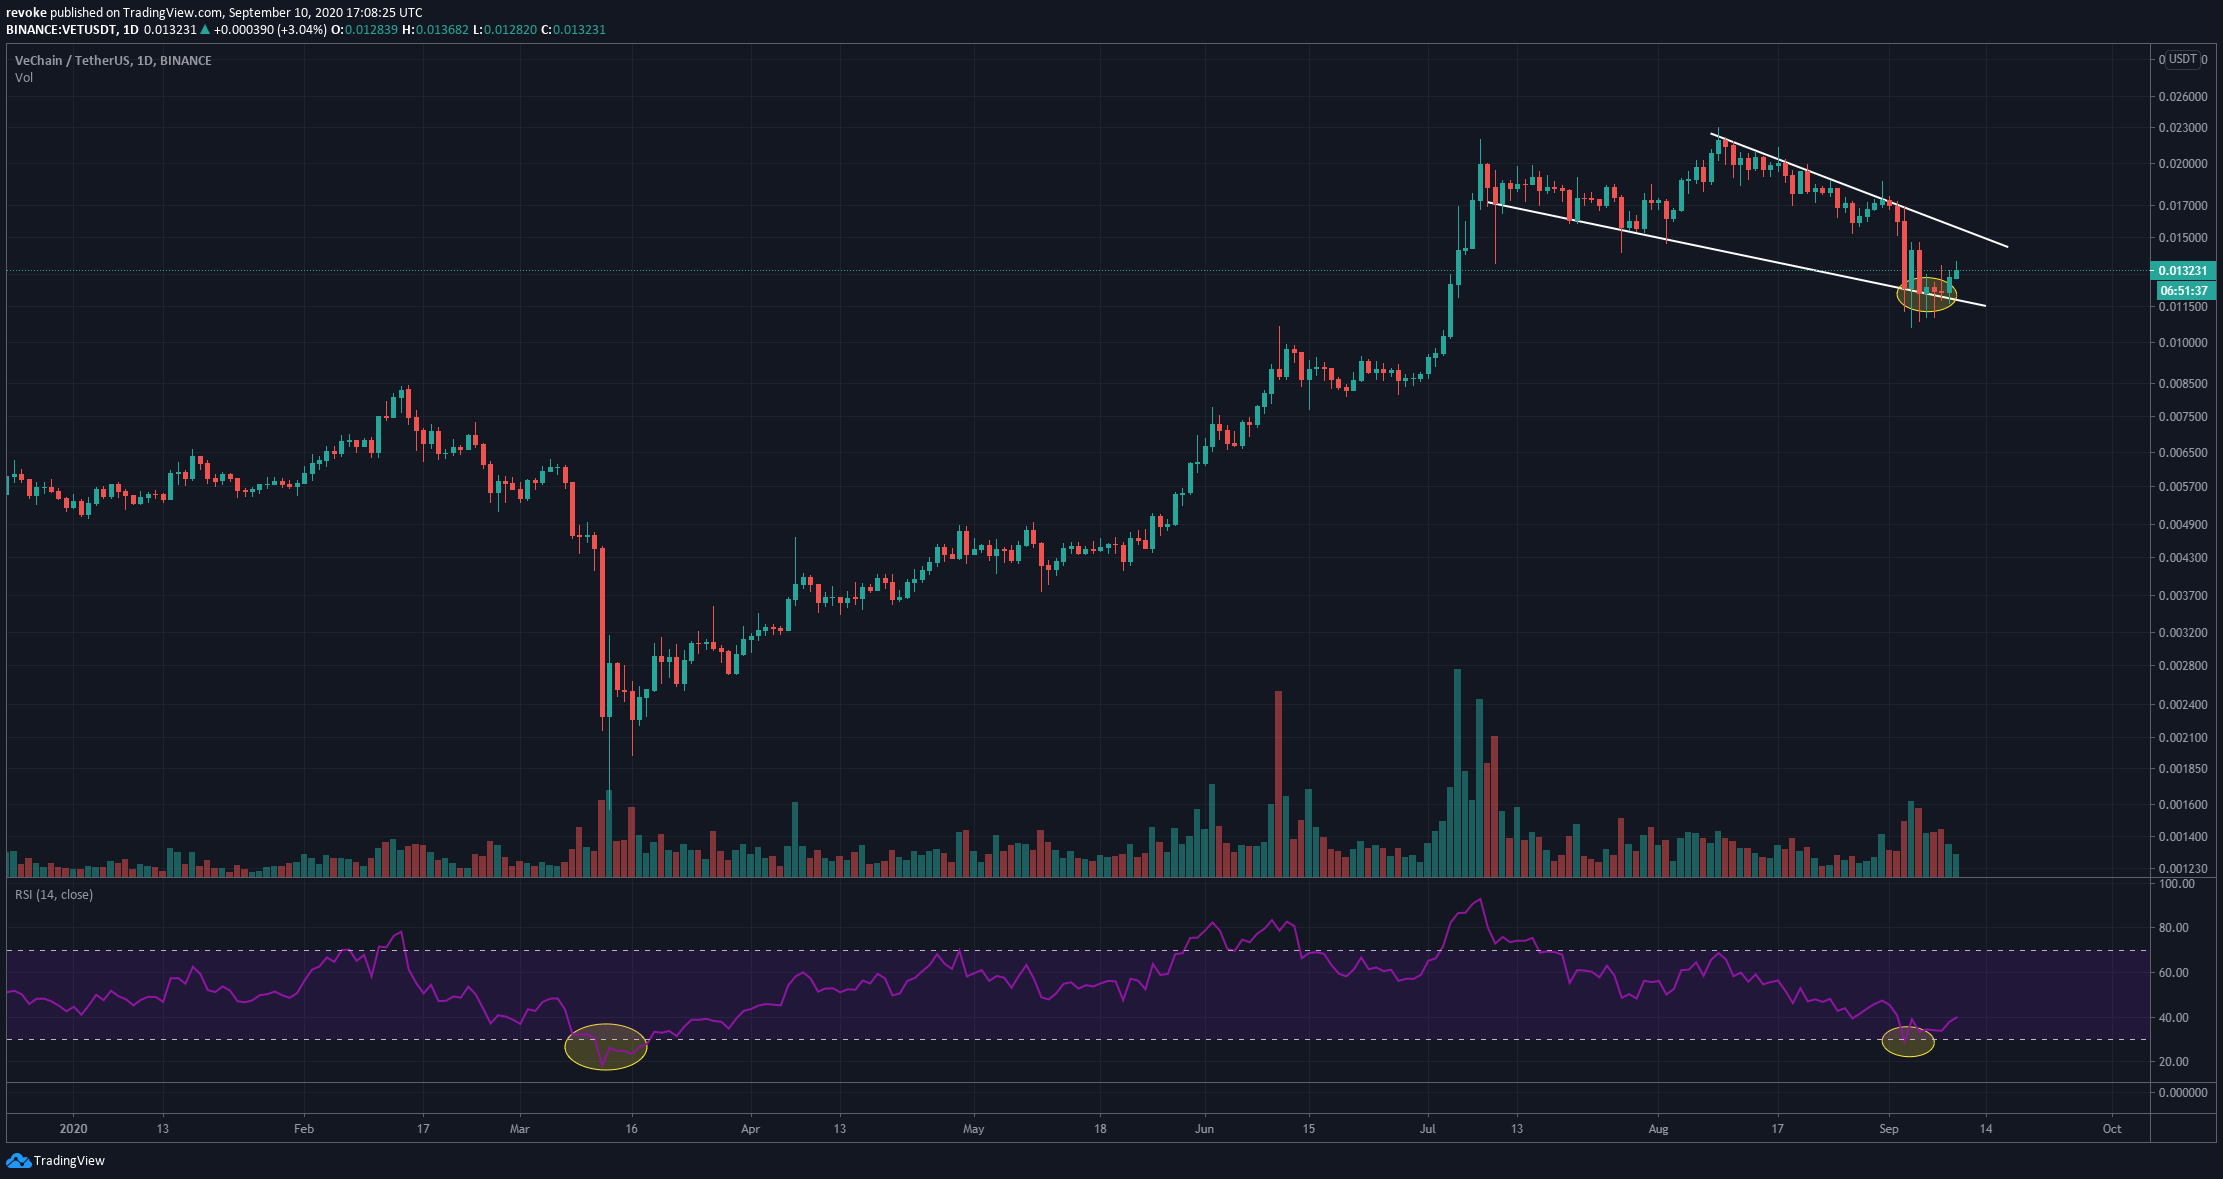
VET price formed a symmetrical triangle on the daily chart, although quite close to a parallel channel. Either way, bulls have defended the lower trendline for a week straight. The upper trendline served as a strong resistance line right after the peak at $0.022 on August 9.
The upper line is currently at around $0.0154, which will be a strong resistance level from a technical standpoint. The RSI did go below 30, and VET is now bouncing just like it did on March 12 after the RSI touched 18. If history repeats, VeChain is poised to have another significant rally from this point onwards.
VET/USD 12-hour chart
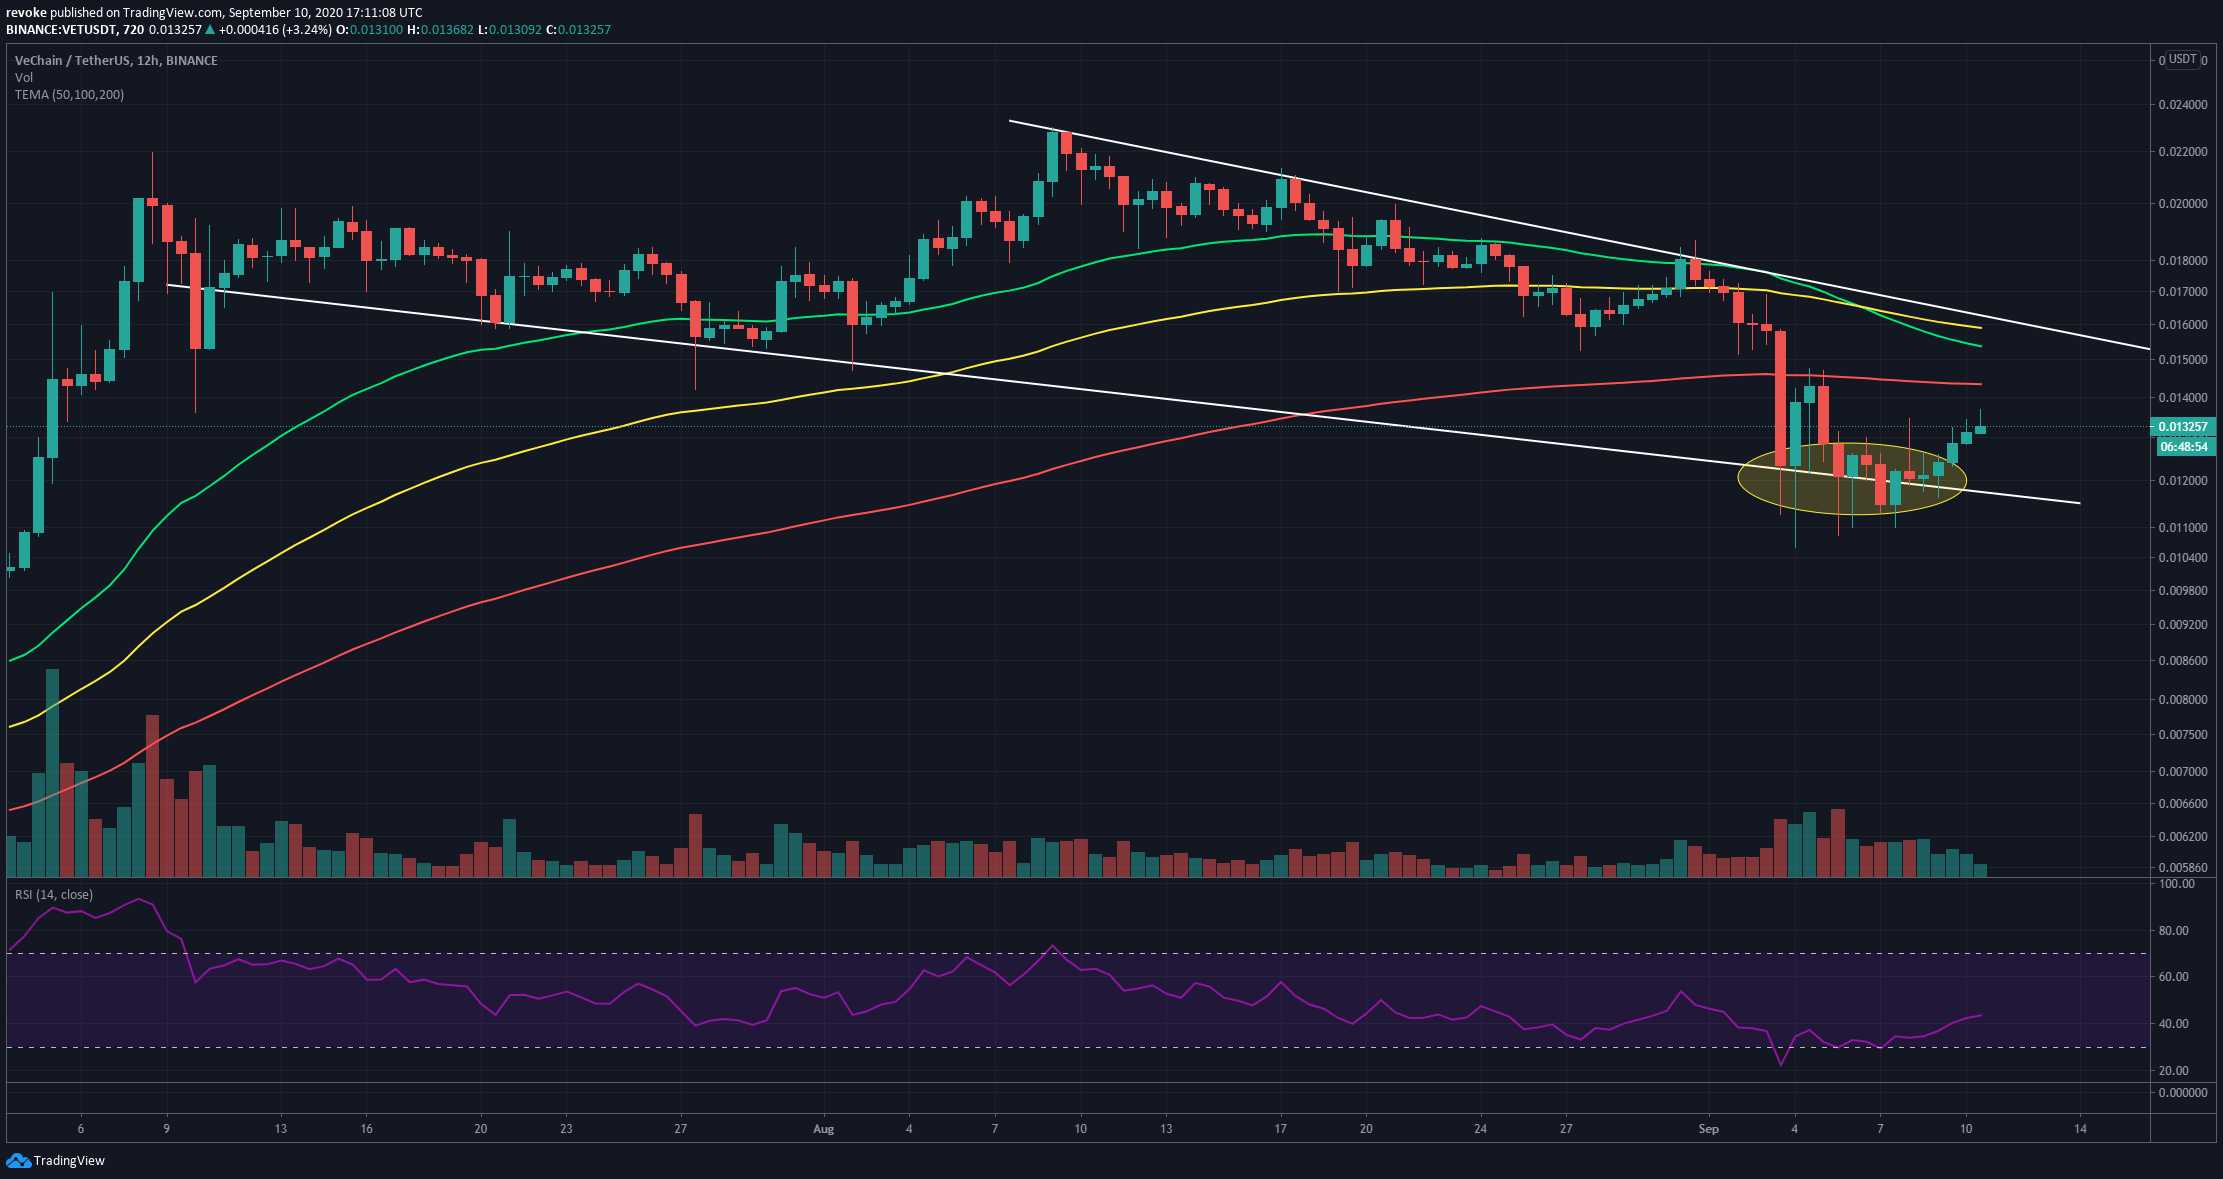
The picture is quite similar on the 12-hour chart; however, the 50-MA, 100-MA, and 200-MA will be acting as resistance levels on the way to the upper trendline. They are $0.0153, $0.0159, and $0.0143, respectively.
VET/USD 4-hour chart
-637353549994400985.png)
This chart is the most important in the short-term. Bulls helped VET price establish an uptrend with a higher low and a higher high. The last higher high, however, was dangerously close to the last high at $0.0134 and could be considered a double top if bulls can’t get any followthrough, which means that the next couple of hours are going to be critical to establishing a clear direction for VeChain.
Author

Lorenzo Stroe
Independent Analyst
Lorenzo is an experienced Technical Analyst and Content Writer who has been working in the cryptocurrency industry since 2012. He also has a passion for trading.




