Uniswap threatens to trade into the single digits as UNI price collapses
- Uniswap price crashes below primary support zones.
- Final price support level ahead.
- A genuine threat for Uniswap to trade back to single digits.

Uniswap (UNI) price action during the intraday session has been violent. UNI has pushed through nearly all of its primary support structures on the daily chart. The $30 price level has proven to be a strong resistance level and the failure to breach above that range has exacerbated the price collapse during the Tuesday trading session.
UNI could push lower to below the $10 range price range
UNI price resistance at $30 has been a difficult range to crack. Two primary reasons for the difficulty of moving above $30 are the 2021 VPOC (Volume Point-Of-Control) at $28.75 and the top of the weekly Cloud (Senkou Span B) at $31.09. Contributing to the speed of the flash crash is the thin volume profile between $23.00 and $25.60 - it is very easy for UNI price to move through such a thinly traded Volume Profile.
The nearest direct support for UNI is at $22.30. The 50% Fibonacci Retracement is within this price range, as is the bottom of the Cloud (Senkou Span B) and the weekly Tenkan-Sen. If bulls fail to hold $22.30, then the final support zone is at $20. The last high volume node in the volume profile and the 38.2% Fibonacci Retracement exist.
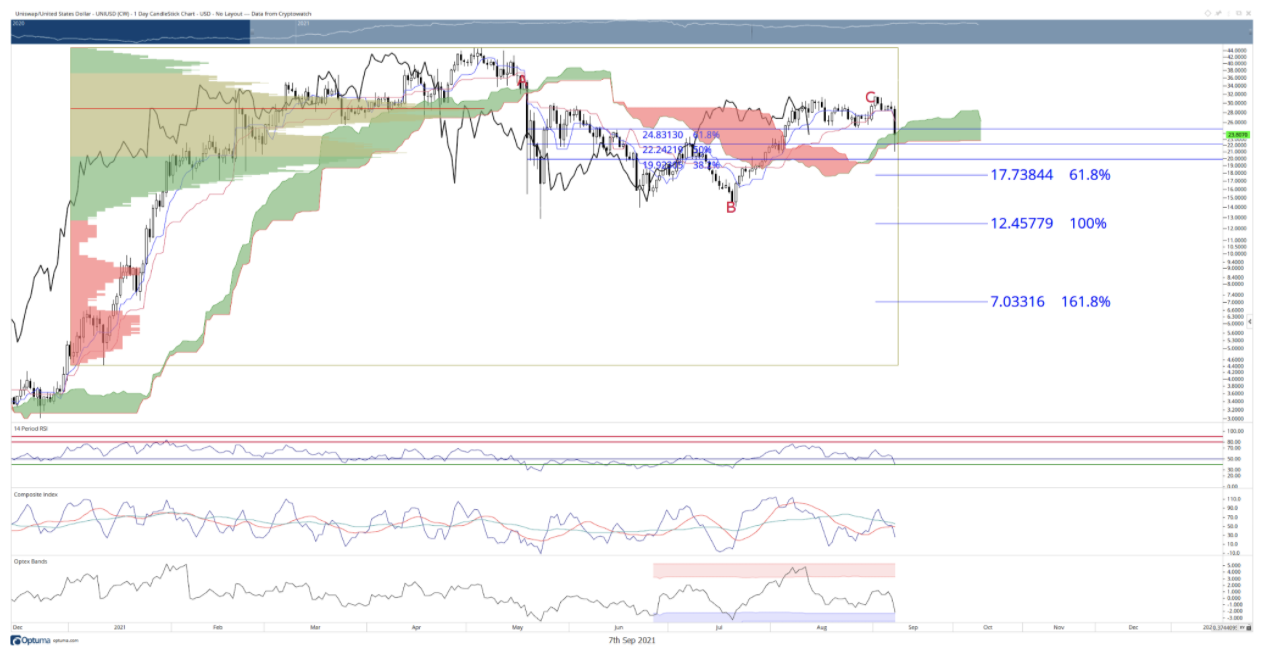
UNI/USD Daily Chart
A word of warning to bears: a series of oscillators point to oversold conditions. The RSI is slightly below the final oversold level in a bull market (40), but there remains a good chunk of the trading day left for bulls to push UNI higher. Additionally, the OPTEX line is right on top of the first oversold condition - this hasn’t happened July 19th, 2021, when UNI began its move recent bull move from $14 to the $30 range.
Fundamentally, there remains some concerns among UNI holders concerning recent governance issues. Whether this has any weight on the present conditions remains to be seen.
Author

FXStreet Team
FXStreet
Composed of a group of economic journalists and FX experts, the FXStreet content team produces and oversees all content published on FXStreet. It provides a purely journalistic approach to the Forex market.



