Uniswap sell-off looms as whales move 19M UNI to Coinbase Prime
- A dormant wallet linked to Uniswap transferred 9 million UNI to Coinbase Prime.
- Four wallets connected to Uniswap transferred 19.21 million UNI to Coinbase Prime in a six-day period.
- A falling wedge pattern breakout projects a 52% move to $7.84 in the near term.
- UNI’s position below key moving averages, including the 50-, 100-, and 200-EMAs, could challenge the anticipated breakout.

Uniswap (UNI) price extends gains by more than 1% to $5.35 at the time of writing on Wednesday. The uptick in UNI’s price comes amid heightened whale activity, with previously dormant addresses linked to the project making significant transfers to Coinbase Prime.
Wallets linked to Uniswap moved 19 million UNI to Coinbase Prime
Wallets connected to Uniswap, the second-largest decentralized exchange (DEX) by daily trading volume, have transferred 19.21 million UNI, worth approximately $102.7 million, as of the current exchange rate, to Coinbase Prime over the last week.
According to Spot On Chain data, the latest transfer involved a wallet that had been dormant for nearly five years. This address deposited 9 million UNI worth approximately $48.1 million to the exchange.
Another wallet linked to @Uniswap just deposited 9M $UNI ($47.5M) to #CoinbasePrime after 4.58 years of dormancy!
— Spot On Chain (@spotonchain) April 30, 2025
In the last 6 days, four wallets connected to the project have transferred 19.21M $UNI ($108.5M) to Coinbase Prime, at an average price of $5.65.
For more $UNI… https://t.co/9tau0ztsAe pic.twitter.com/jwbzRK0475
Transfers, particularly from wallets associated with a crypto project, raise concerns about potential dumping, which could trigger liquidity spikes and hinder price recovery. Uniswap has yet to release a statement on the transfers.
Uniswap’s price holds steady in the early European session on Wednesday, up more than 1% on the day. The token’s derivatives market displays a slightly positive outlook, with the Open Interest (OI) increasing by 0.75% to approximately $246 million, according to Coinglass data.
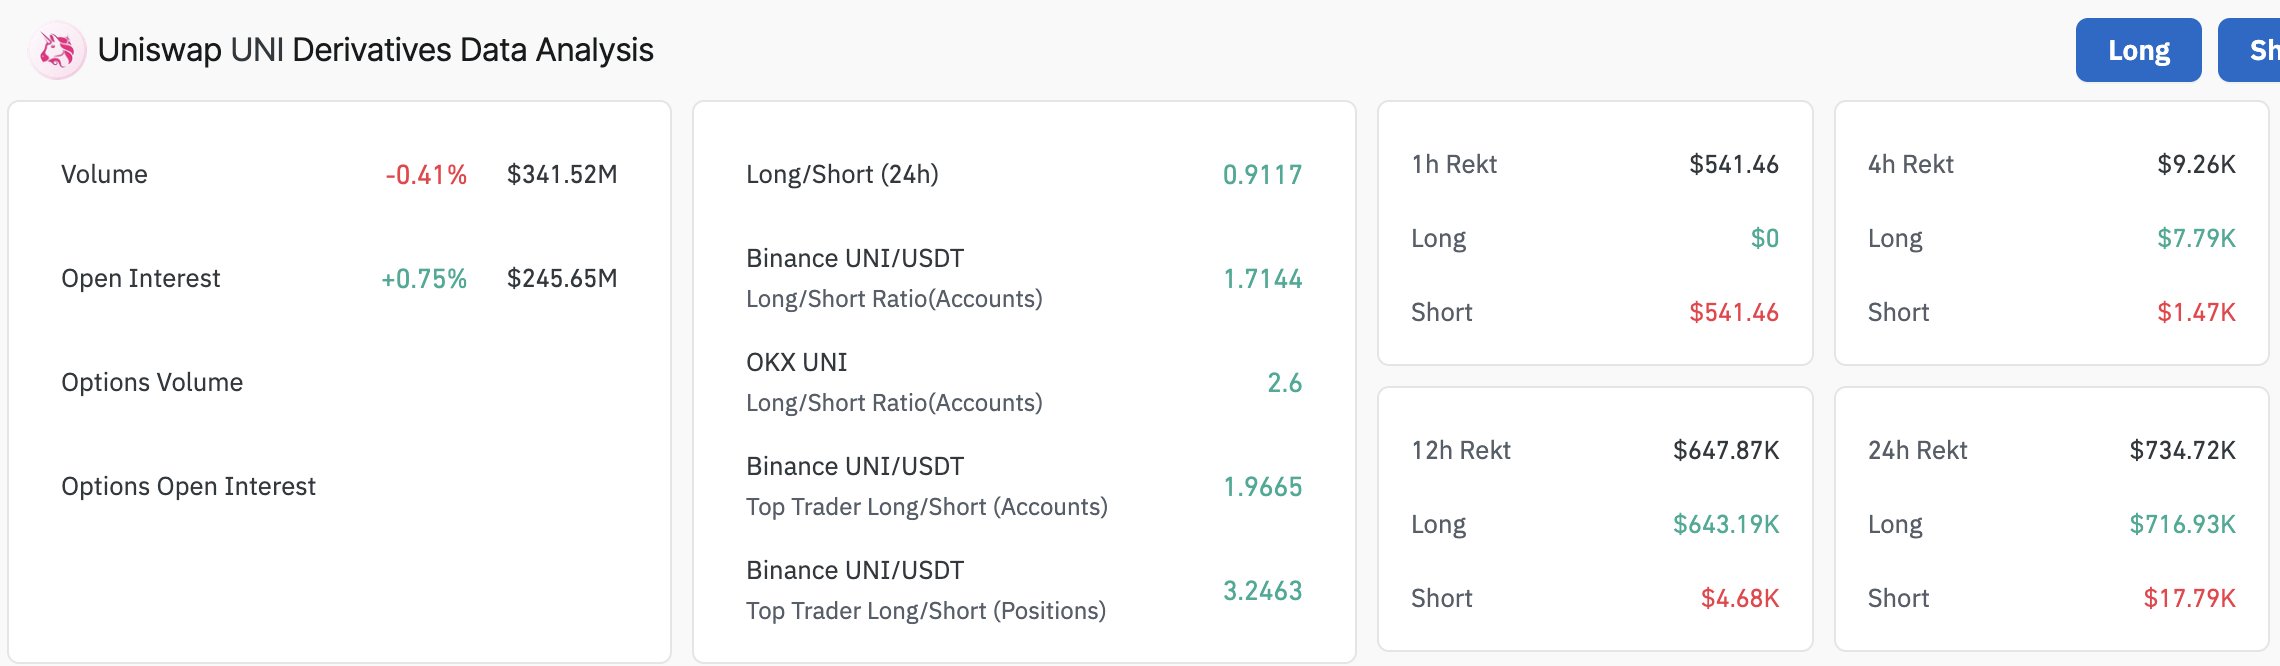
Uniswap derivatives data | Source: Coinglass
The Binance long/short ratio of 1.7144 reflects a bullish sentiment among traders, anticipating a rise in Uniswap’s price, with an even stronger ratio of 2.6 on OKX. However, traders should remain cautious due to a slight 0.41% drop in volume to $341.5 million.
Uniswap price shows potential for a 52% breakout
Since December, Uniswap’s performance in the last five months has been dismal, with the daily chart highlighting a downward trend marked by lower highs and lows. UNI remains below the 50-, 100-, and 200-day Exponential Moving Averages (EMAs), indicating a growing imbalance between a stronger bearish structure and a struggling bullish outlook.
However, forming and validating a falling wedge pattern could boost UNI’s bullish outlook, paving the way for a 52% breakout to $7.84. This is a bullish pattern that occurs during downtrends. It is characterized by two converging trendlines that slope downward.
Uniswap broke above the upper trendline on April 20, accompanied by a spike in trading volume. However, UNI was rejected at $6.00, close to the 50-day EMA, leading to a minor reversal.
Bulls now have an uphill task to steady the intraday gains while focusing on the wedge pattern’s breakout potential to $7.84. Breaking above the 50-day EMA could accelerate the bullish momentum towards $10.00. However, the 100-day EMA at $7.35 and the 200-day EMA at $8.38 could slow the uptrend.
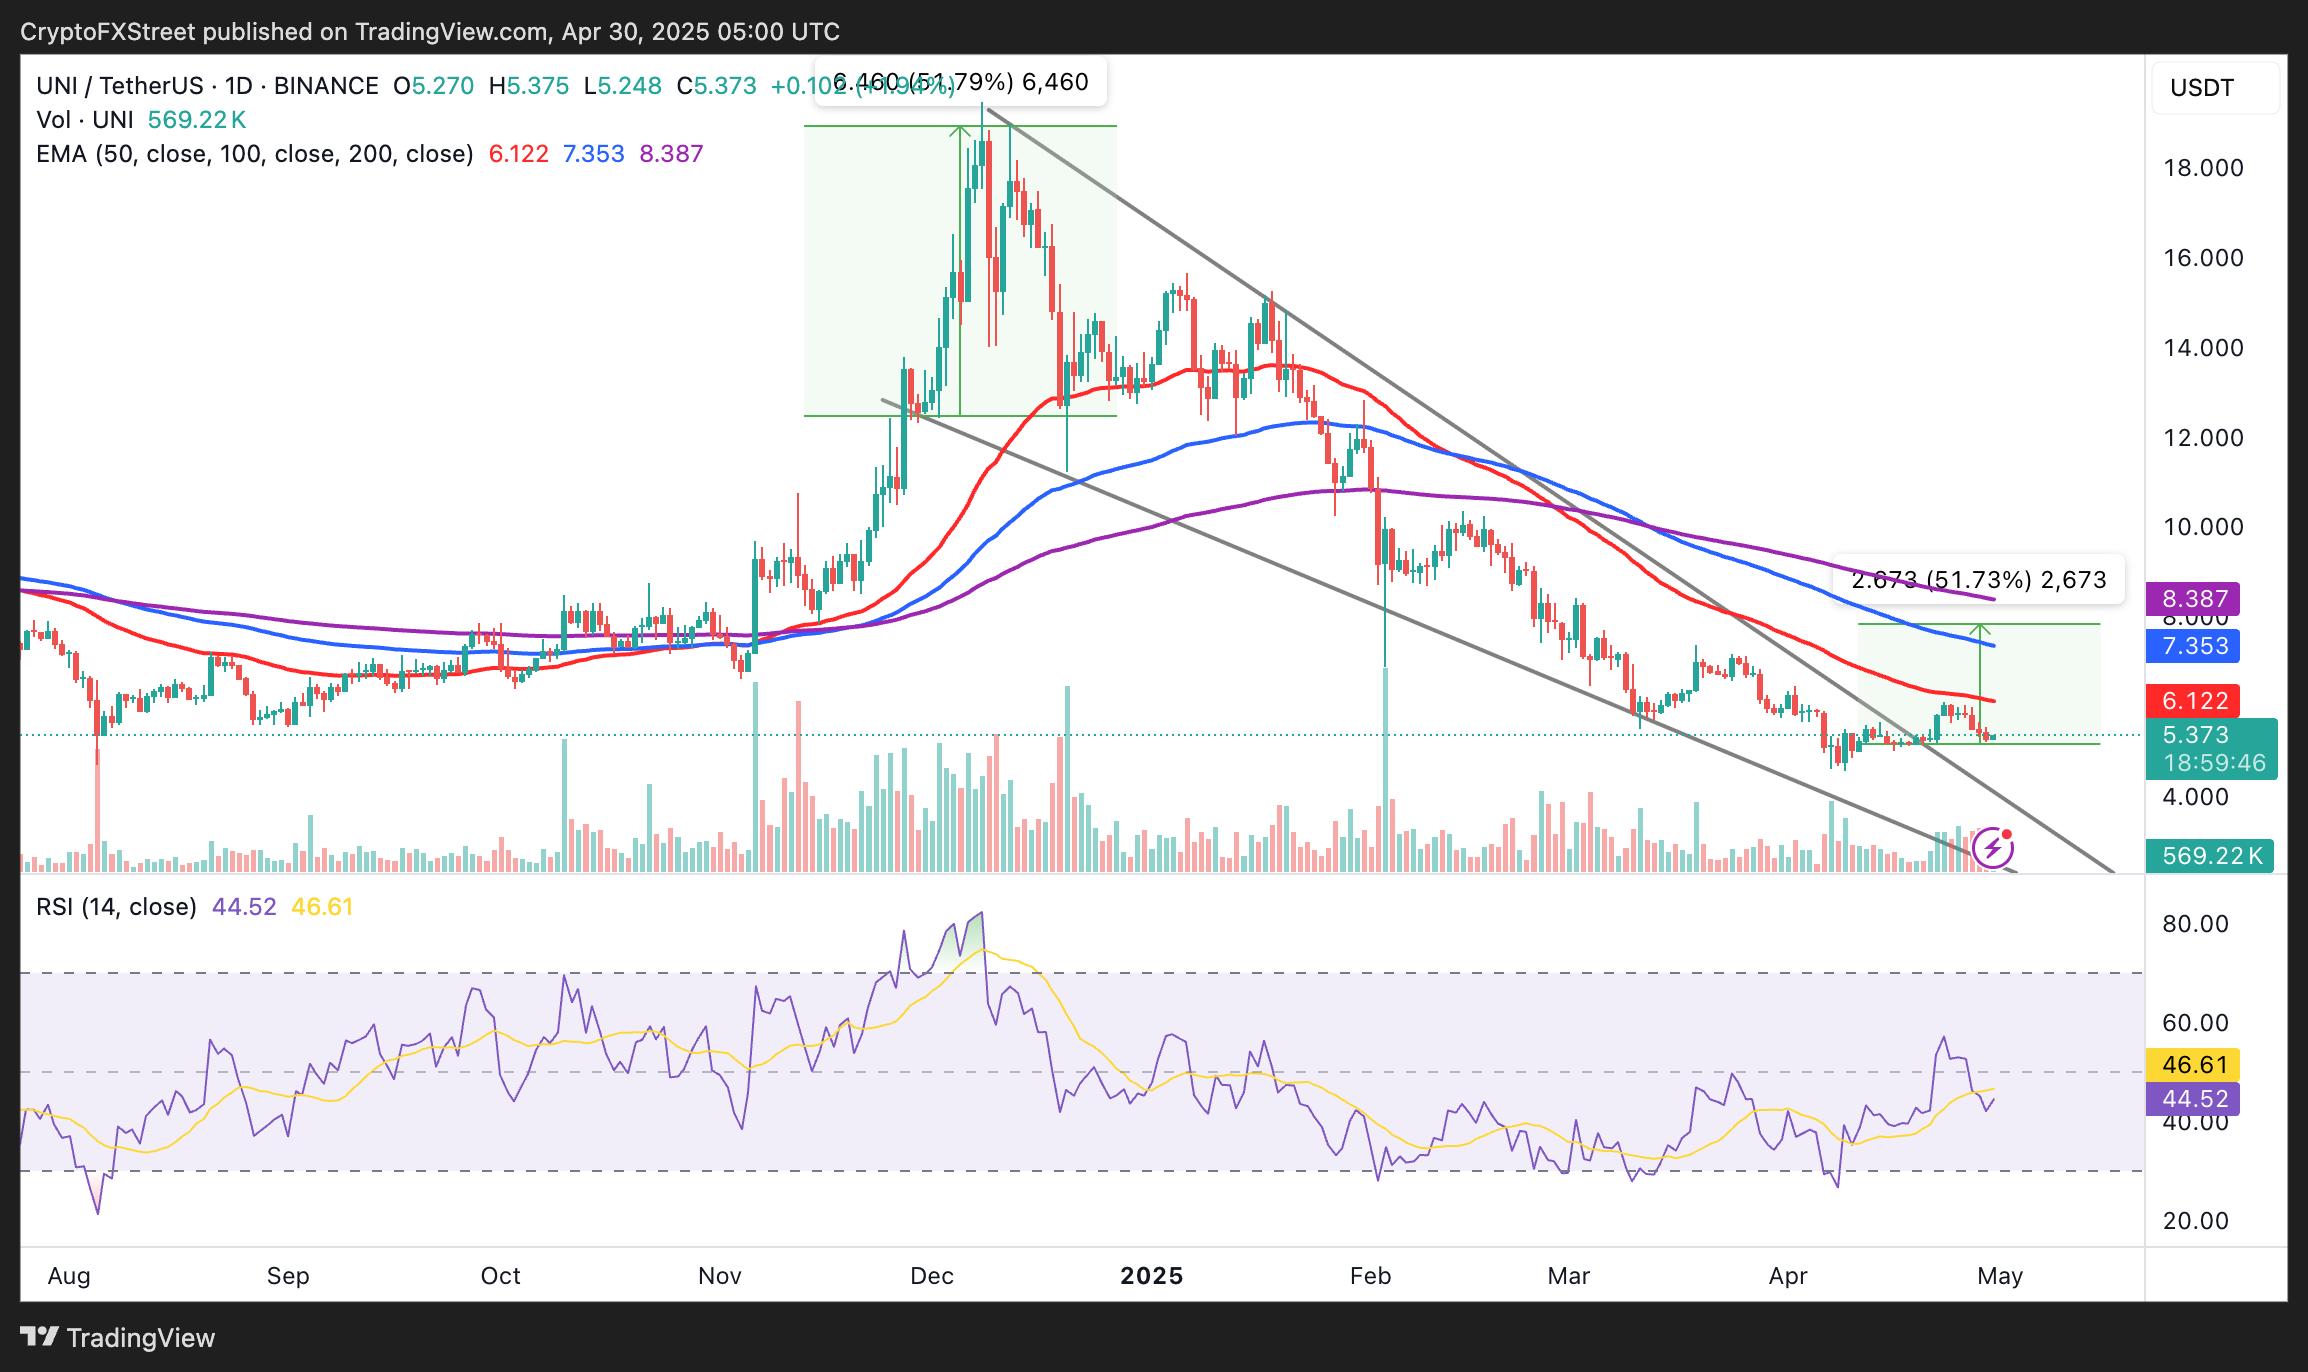
UNI/USDT daily chart
The Relative Strength Index (RSI) is at 44, up from 42, but sits below the midline zone of 50. This suggests that while momentum is improving post-breakout, UNI faces potential downward pressure, likely pushing the price down to test and collect liquidity at $4.50, which is April’s support.
Cryptocurrency metrics FAQs
The developer or creator of each cryptocurrency decides on the total number of tokens that can be minted or issued. Only a certain number of these assets can be minted by mining, staking or other mechanisms. This is defined by the algorithm of the underlying blockchain technology. On the other hand, circulating supply can also be decreased via actions such as burning tokens, or mistakenly sending assets to addresses of other incompatible blockchains.
Market capitalization is the result of multiplying the circulating supply of a certain asset by the asset’s current market value.
Trading volume refers to the total number of tokens for a specific asset that has been transacted or exchanged between buyers and sellers within set trading hours, for example, 24 hours. It is used to gauge market sentiment, this metric combines all volumes on centralized exchanges and decentralized exchanges. Increasing trading volume often denotes the demand for a certain asset as more people are buying and selling the cryptocurrency.
Funding rates are a concept designed to encourage traders to take positions and ensure perpetual contract prices match spot markets. It defines a mechanism by exchanges to ensure that future prices and index prices periodic payments regularly converge. When the funding rate is positive, the price of the perpetual contract is higher than the mark price. This means traders who are bullish and have opened long positions pay traders who are in short positions. On the other hand, a negative funding rate means perpetual prices are below the mark price, and hence traders with short positions pay traders who have opened long positions.
Author

John Isige
FXStreet
John Isige is a seasoned cryptocurrency journalist and markets analyst committed to delivering high-quality, actionable insights tailored to traders, investors, and crypto enthusiasts. He enjoys deep dives into emerging Web3 tren


