Uniswap price still undecided, as UNI moves to shield itself from regulators
- Uniswap price lays bear trap after briefly breaking the lower trend line of the governing symmetrical triangle pattern.
- The best three-day gain since May fails to gain traction, despite the improving cryptocurrency complex.
- UNI delists 100 tokens as regulatory scrutiny increases over the decentralized finance (DeFi) space.

Uniswap price rebound has stuttered over the last four trading days showing no progress, despite the continuing surge in Bitcoin from the July 20 low, keeping the altcoin coiling in the symmetrical triangle. Even though UNI did provoke a bear trap, the bearish outlook is preserved until UNI can claim a daily close above the triangle’s upper trend line.
Uniswap blacklists synthetic and tokenized stocks
In response to increased scrutiny from governments and regulatory bodies, the decentralized finance platform, Uniswap, announced on Friday it was restricting access to 100 crypto tokens on the trading app. The tokens include synthetic assets intended to track the prices of major stocks like Tesla and Facebook and exchange-traded funds (ETFs) that mimic particular equity indexes like the NASDAQ 100.
Other synthetic tokens restricted were those established to track gold and oil futures, the Japanese yen, Korean won and cryptocurrencies like Bitcoin. Overall, it appears that the delisted instruments are those at risk of being classified as securities by a regulator.
The announcement follows the blunt remarks of the U.S. Securities and Exchange Commission (SEC) Chairman Gensler on July 21 about crypto projects that use tokens to mirror the activities of securities. He stated that the “platforms - whether in the decentralized finance or centralized finance space - are implicated by the securities laws and must work within our securities regime.”
Make no mistake, regulatory agencies and governments are concerned by the new frontiers of finance being introduced by the DeFi space. They are upping the pressure, causing a scramble to avoid being caught in a regulatory nightmare.
Uniswap price waiting for pattern resolution to determine trend
Uniswap price, similar to other altcoins, has struggled to manufacture a sustainable bid to catapult it beyond the technical interference outlined on the charts. One layer of contention is the 50-day simple moving average (SMA). The indicator impeded the continuation of the rally in June-July, pressing UNI down almost 40%. Similarly, the moving average rejected the digital token yesterday and is doing the same today.
A secondary obstacle to Uniswap price success is the upper trend line of the symmetrical triangle beginning after the May crash. The trend line also imposes downward pressure on the digital asset, especially with a continuation pattern.
A downward resolution of the pattern begins with a new daily close below the triangle’s lower trend line, currently at $15.00. To provide confirmation, a daily close below the July 21 low of $14.02. The measured move of the triangle is 56%, projecting a Uniswap price target of $6.60, taking UNI below the September 2020 high of $8.67.
In the work of Edwards and Magee, they suggest that 75% of symmetrical triangles are continuation patterns and the remaining are reversals. Thus, a downward resolution of the formation is a high probability event that should be expected for Uniswap price.
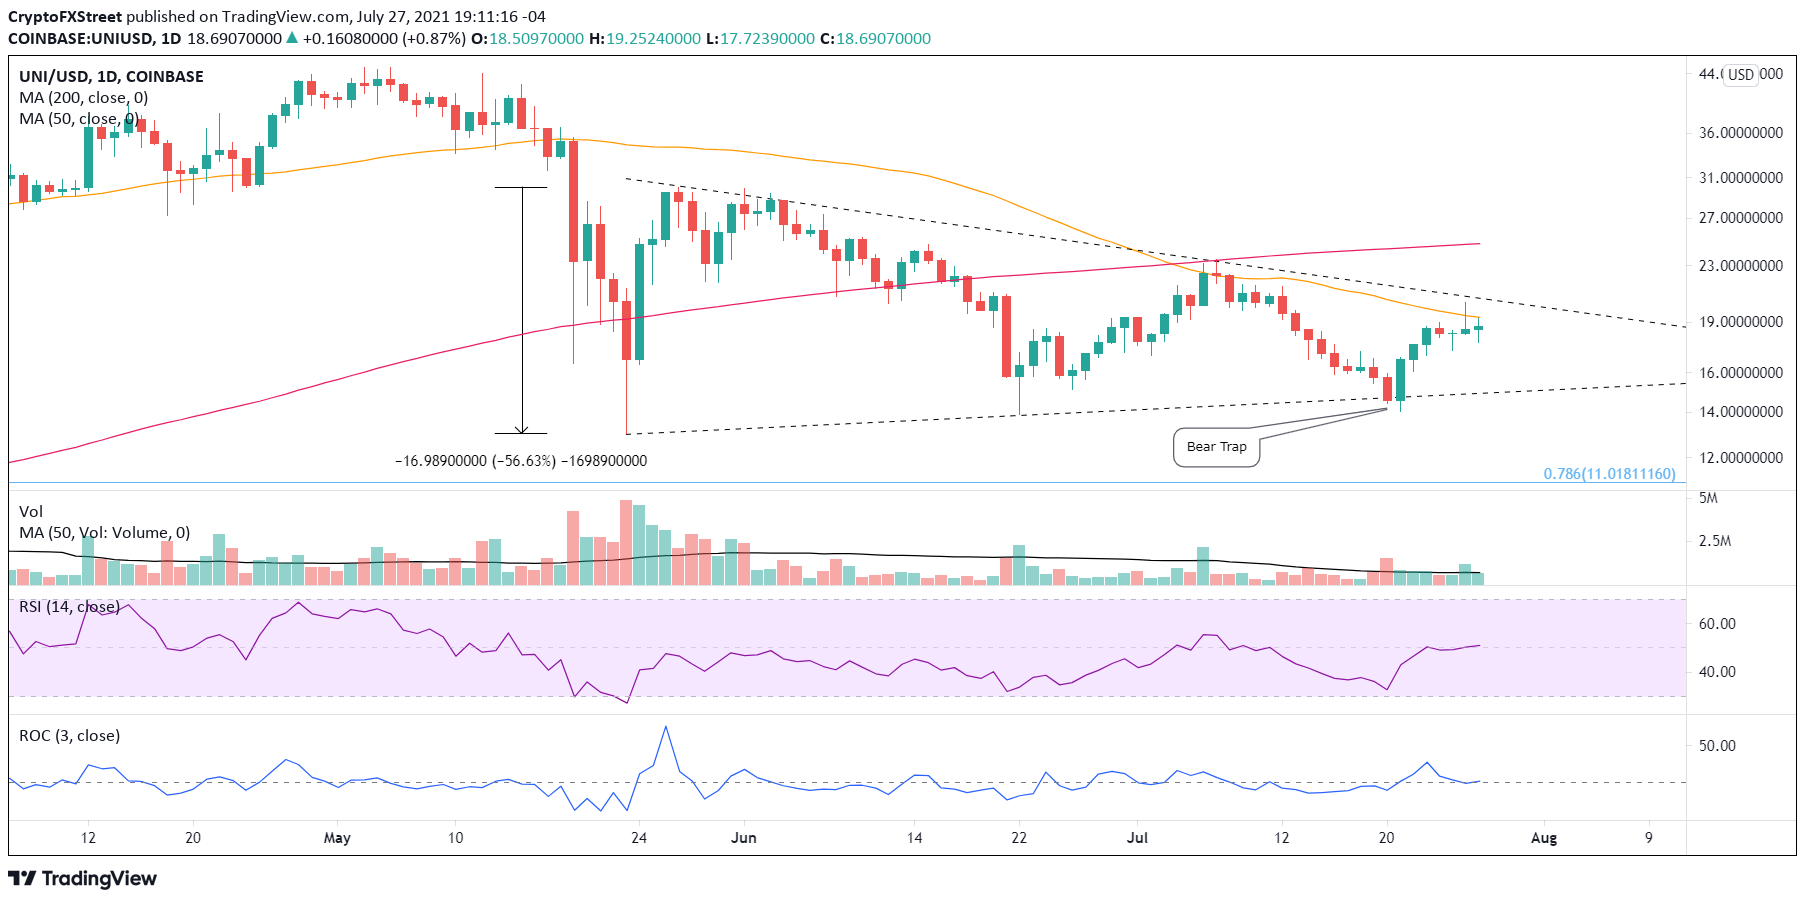
UNI/USD daily chart
If Uniswap price manages to shed the technical restraints of the 50-day SMA and the triangle’s topside trend line, UNI market speculators can entertain a move to the upside measured move price target of $32.16.
The Uniswap price move off the July low started with a bang. Still, it has not been sustained with yesterday’s reversal and a sign of distribution, suggesting that UNI market operators are using the strength to trim or close positions. Undoubtedly, the remarks from the SEC Chairman have a dampening effect on Uniswap price. Nevertheless, the symmetrical triangle pattern’s objective power will grant insight into UNI’s future trend intentions before anything else.
Author

Sheldon McIntyre, CMT
Independent Analyst
Sheldon has 24 years of investment experience holding various positions in companies based in the United States and Chile. His core competencies include BRIC and G-10 equity markets, swing and position trading and technical analysis.


