Uniswap Price Prediction: UNI looks poised for a rebound after significant sell-off
- UNI was trading as high as $8 after getting listed on exchanges, however, the selling pressure made the price drop to $3.
- According to several indicators, it seems that UNI is ready for a bounce in the short-term.

UNI was created by Uniswap and was airdropped to everyone that used the exchange before September 1. As a free airdrop, the token was expected to face a lot of selling pressure, however, the price has remained quite strong despite this fact.
Several buy signals could help UNI in the short-term
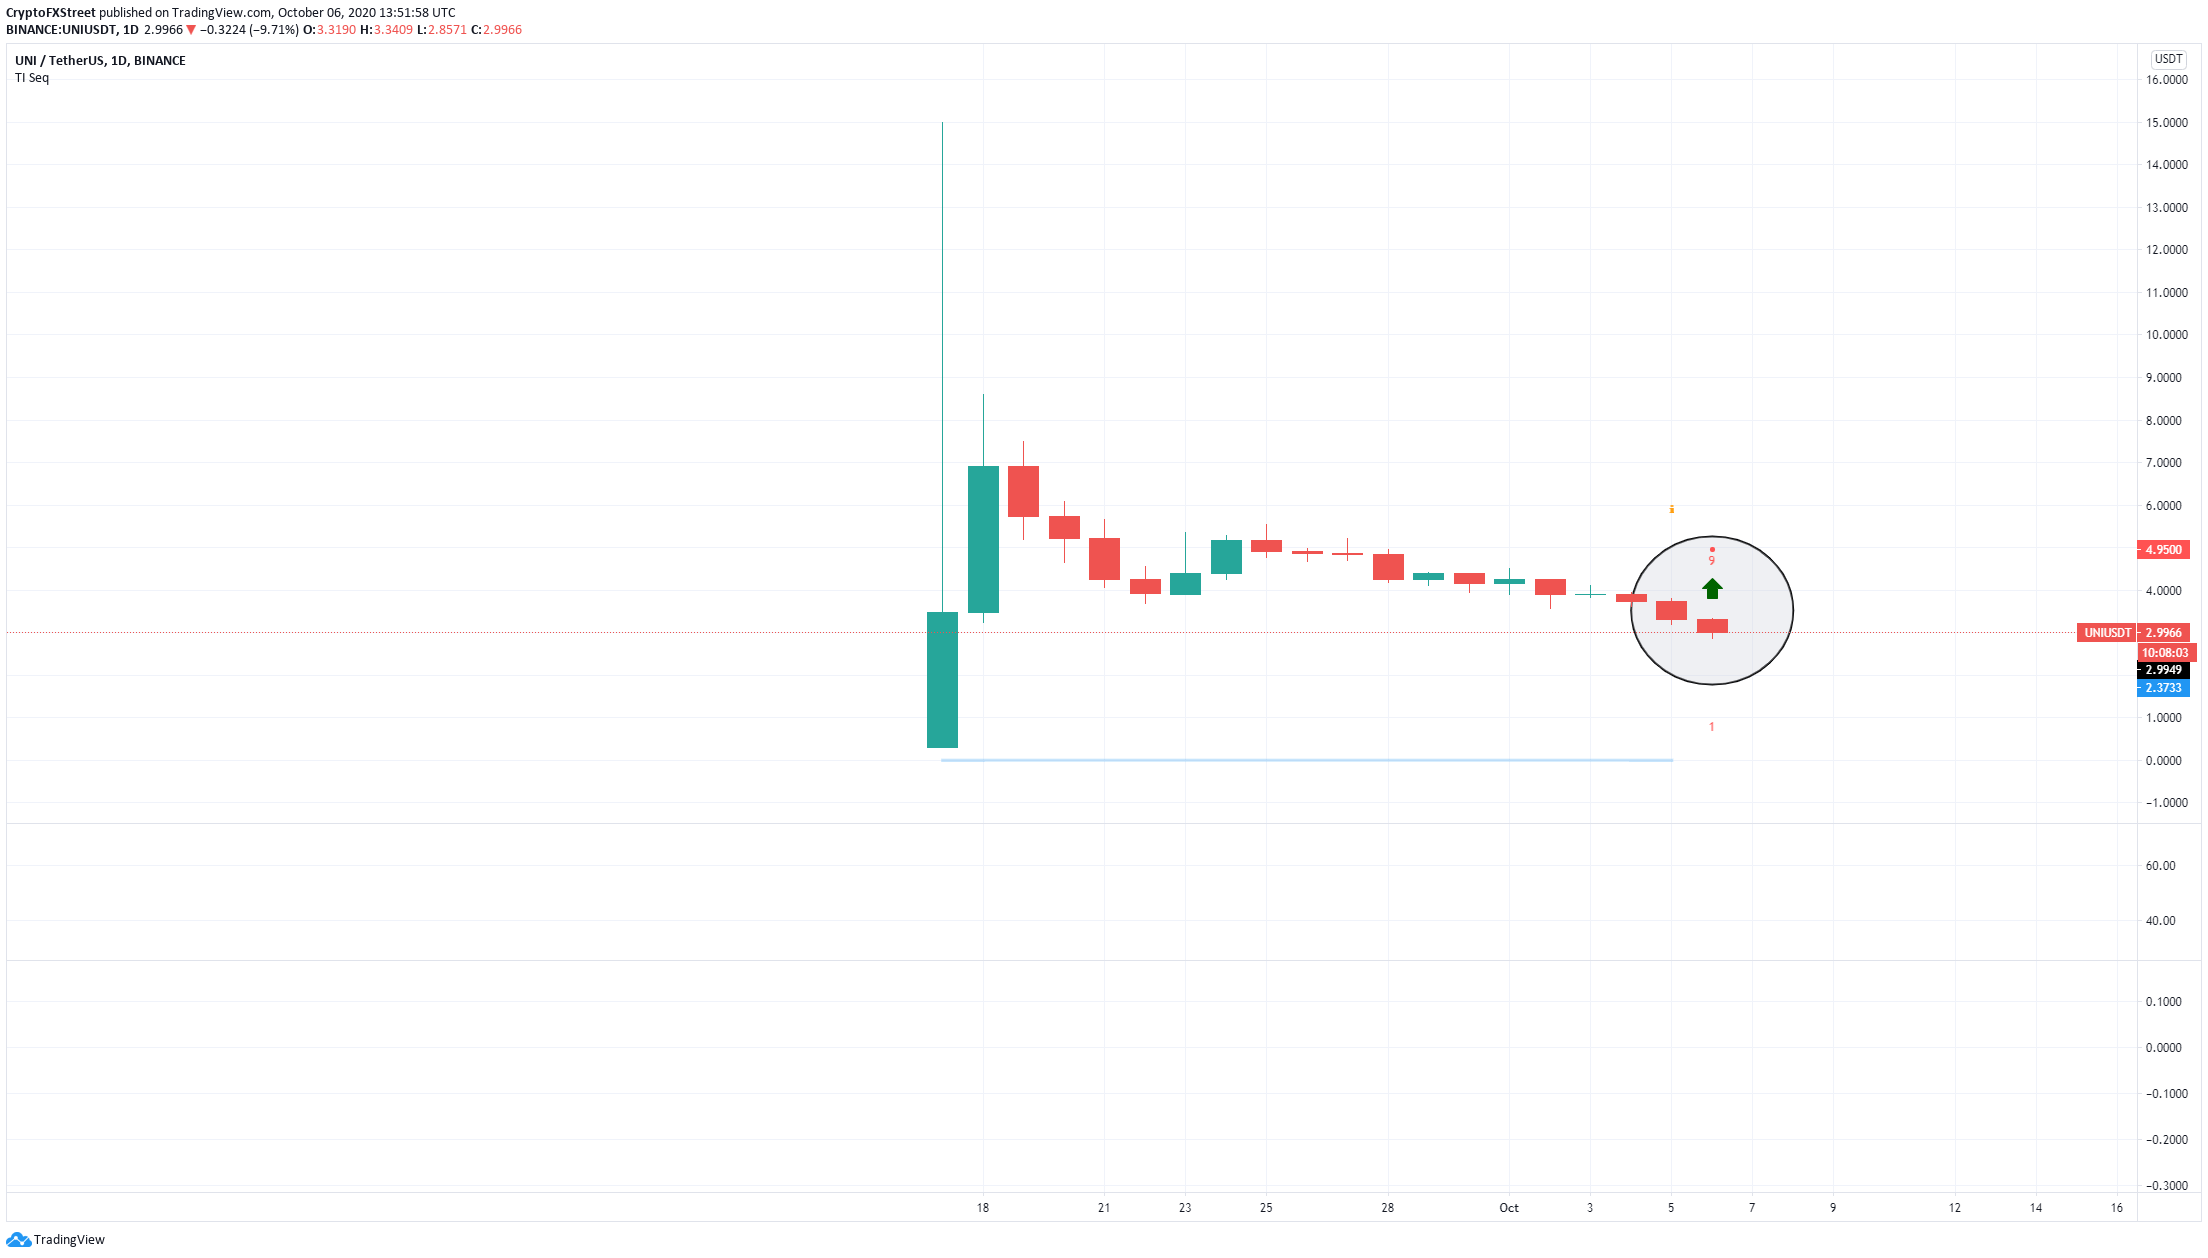
The TD sequential is a reliable indicator that identifies reversals and prints buy or sell signals. If we take a look at the daily chart, we can observe the first buy signal that was formed on October 6.
UNI/USDT daily chart
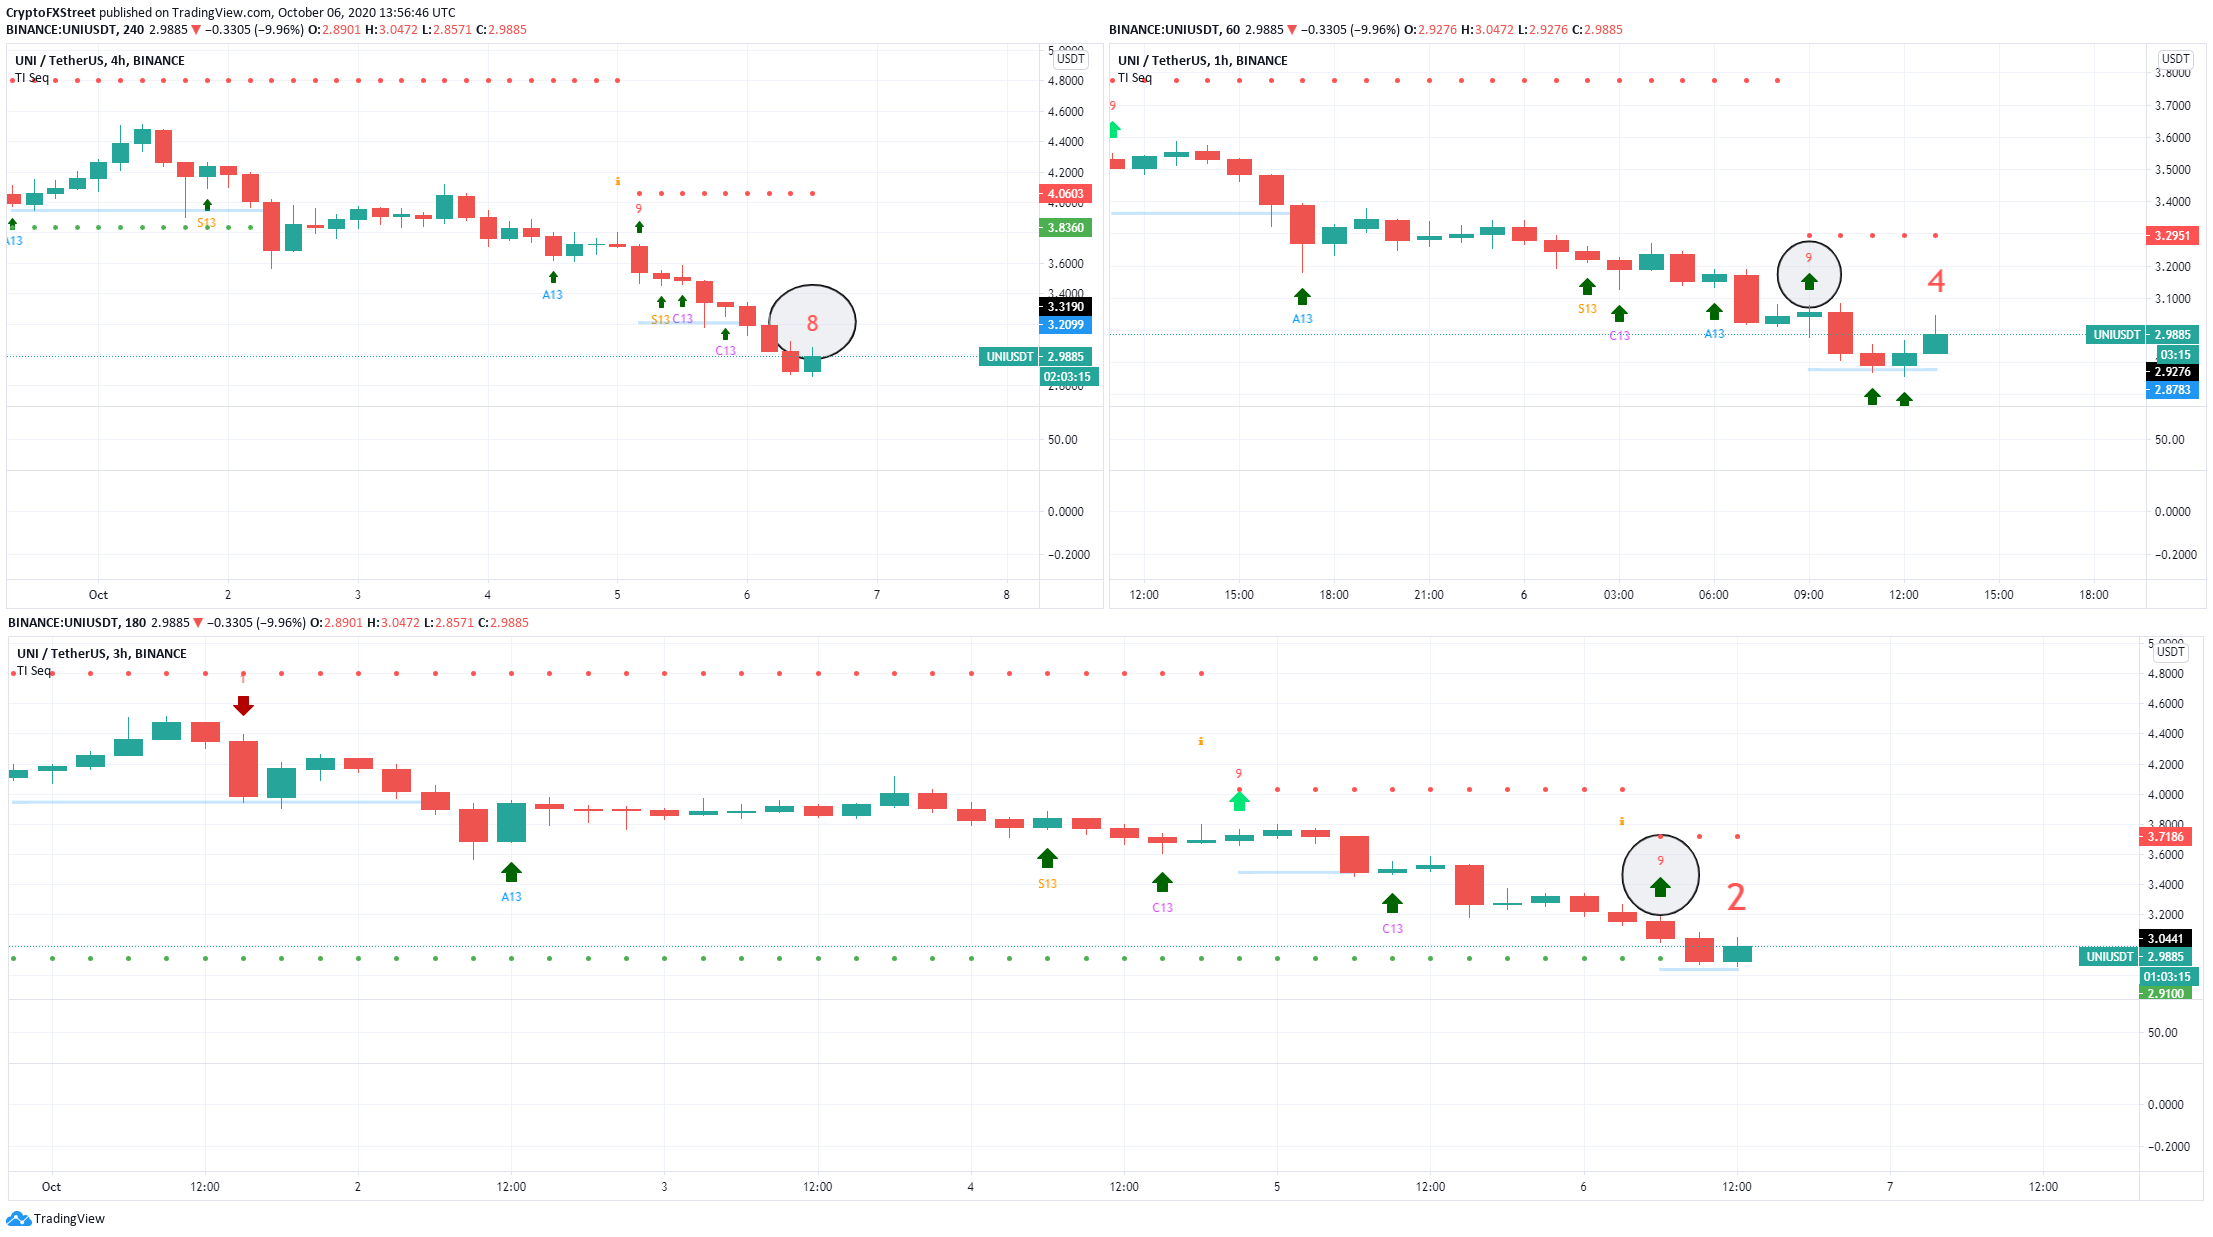
Furthermore, the TD sequential presented several other buy signals on the 3-hour chart, the 1-hour chart and it’s close to creating another signal on the 4-hour chart.
TD Sequential Buy Signals
It also seems that the interest in UNI is increasing recently. According to the new addresses chart provided by IntoTheBlock, the downtrend in new addresses might be coming to an end. On October 3, the number jumped from 1,770 to 1,960 currently.
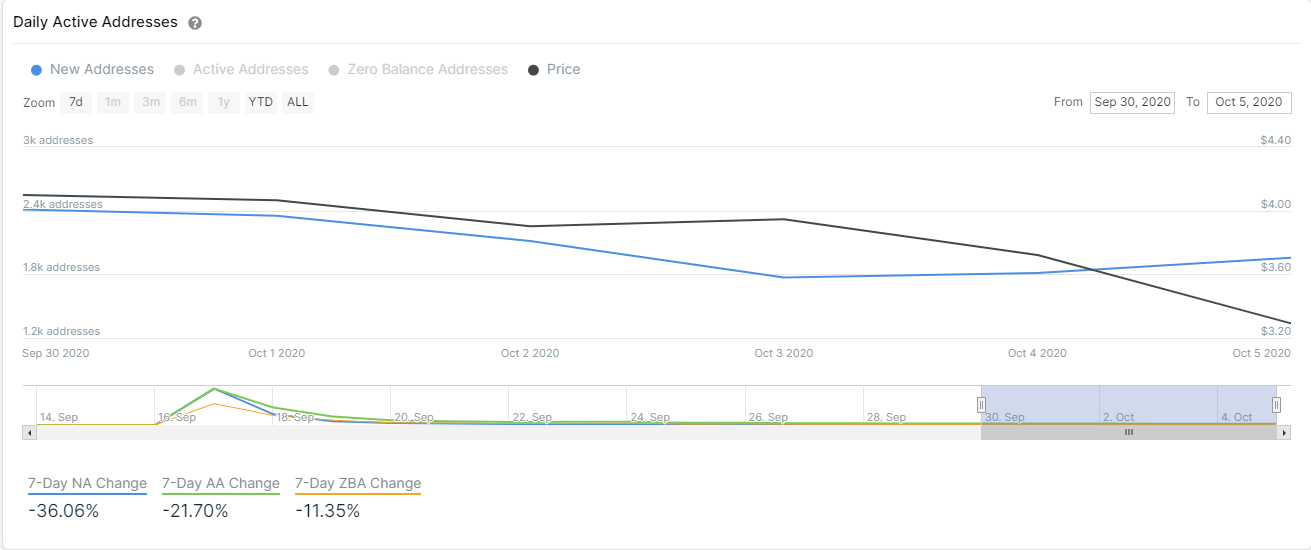
UNI New Addresses
Looking at the In/Out of the Money Around Price chart by IntoTheBlock, we can observe where the biggest resistance level is established. The range between $3.29 and $3.30 where 280,000 UNI tokens were bought is by far the strongest.
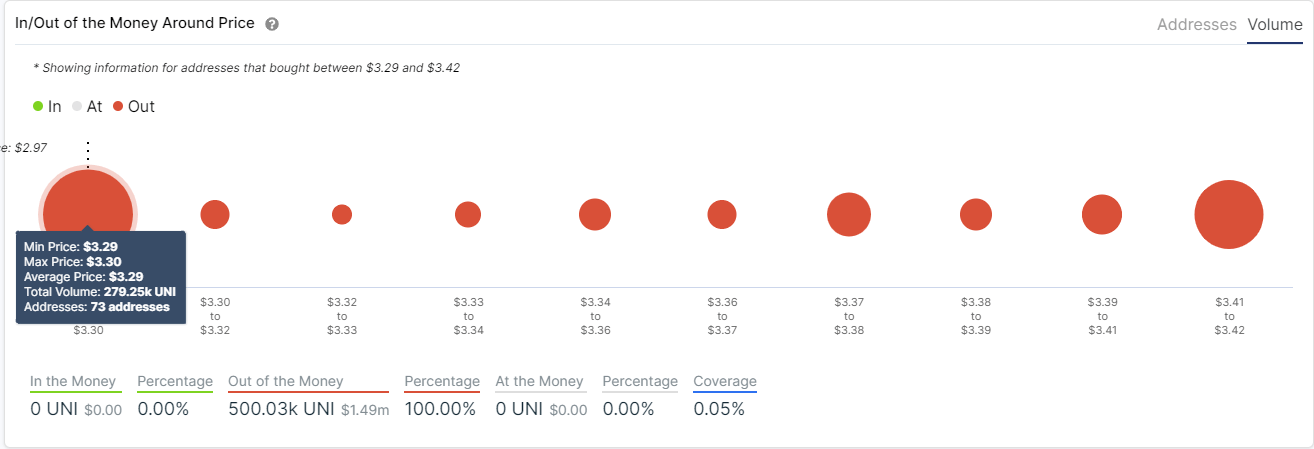
UNI IOMAP Chart
A bullish breakout above $3.30 will most likely take UNI up to $4 where the 50-SMA is currently established on the 4-hour chart.
Not a lot of support for UNI on the way down
Despite the several buy signals presented by the TD sequential indicator, UNI has barely any support on the way down. The 4-hour chart remains extremely bearish even though the TD is close to presenting a buy signal.
The RSI is currently in oversold territory for the first time ever as this is pretty much the lowest price of UNI ever. If the bulls can’t push the digital asset above $3.3, a rejection would bring UNI price below $2.85.
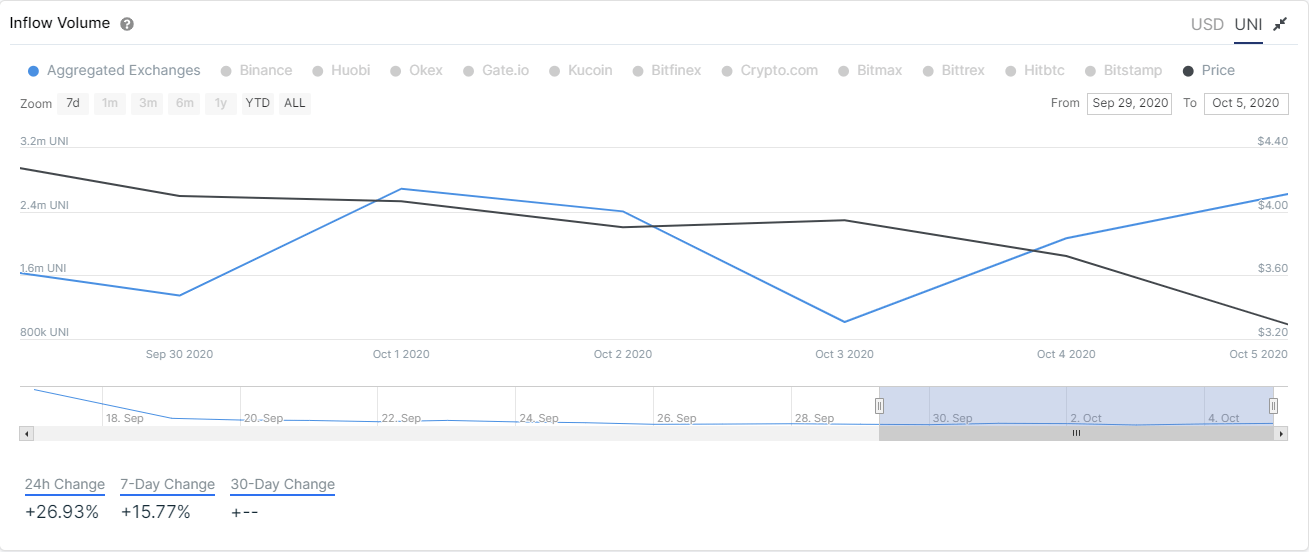
UNI Inflow Volume
The inflow volume of UNI spiked in the last three days, meaning that people are depositing more UNI tokens into exchanges, presumably to sell them. The number of tokens sent to exchanges on October 3 was 1 million, it has increased to 2.6 million currently.
The current sell-off could certainly continue seeing that UNI bulls are facing a lot of resistance to the upside. The number of tokens going to exchanges is concerning and indicates the selling pressure is still here. A bearish rejection from $3.3 would push UNI below $2.85.
On the flip side, several buy signals have been presented on different time frames. The strongest resistance point at $3.3 is a crucial level. If broken, UNI can climb up to $4 at the 50-SMA on the 4-hour chart
Author

Lorenzo Stroe
Independent Analyst
Lorenzo is an experienced Technical Analyst and Content Writer who has been working in the cryptocurrency industry since 2012. He also has a passion for trading.



