Uniswap Price Forecast: UNI is ready to rebound, but first needs to crack $4.2
- UNI is the native token of Uniswap and was airdropped to everyone that used the exchange before September 1.
- Surprisingly, UNI managed to reach $8 despite the massive selling pressure from users.

UNI is currently trading at $4.2 and still hasn’t crashed too significantly even though everyone that used Uniswap before September 1, got 400 tokens. This airdrop was launched in response to SushiSwap decision to migrate close to $1 billion in digital currencies from Uniswap through a 'vampire mining' attack.
Several indicators are showing UNI is ready for a strong bounce
The price of UNI established a strong support level at $3.8 and it’s currently trading right above this level at $4.2
UNI/USD 12-hour chart
-637370031696848658.png)
The TD sequential indicator is on the verge of presenting a buy signal, most likely within the next five hours. For now, the 12-EMA is acting as a strong resistance level at $4.6 although the In/Out of the Money Around Price chart by IntoTheBlock shows more resistance before that.
UNI IOMAP Chart
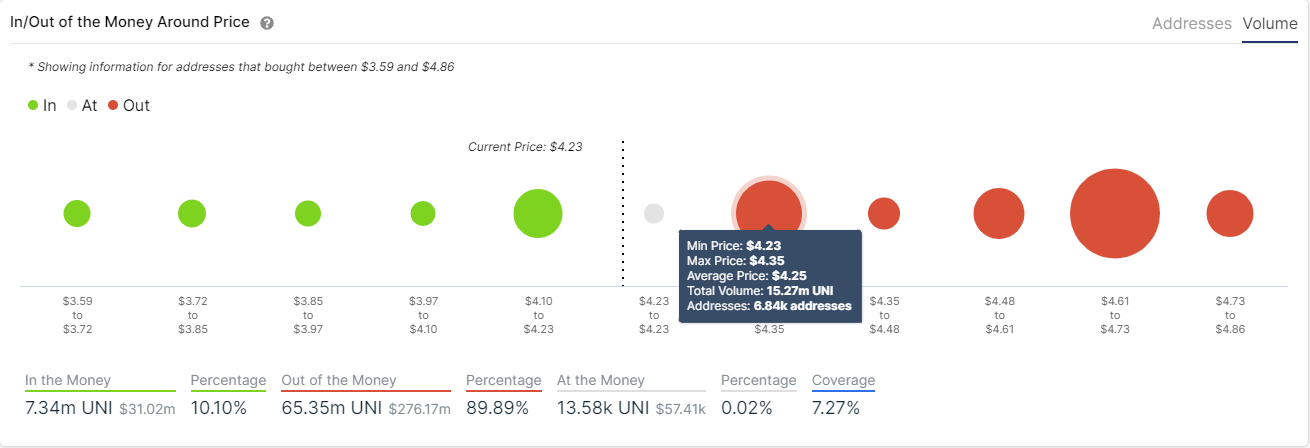
The price range between $4.23 and $4.35 is a notable resistance level as close to 7,000 addresses bought 15 million UNI tokens. At $4.6 and above, the resistance is even greater. Close to 37 million tokens were bought between $4.61 and $4.73, creating a massive area of resistance.
A bullish breakout above $4.2 can take UNI up to the next resistance level at $4.6.
UNI/USD 4-hour chart
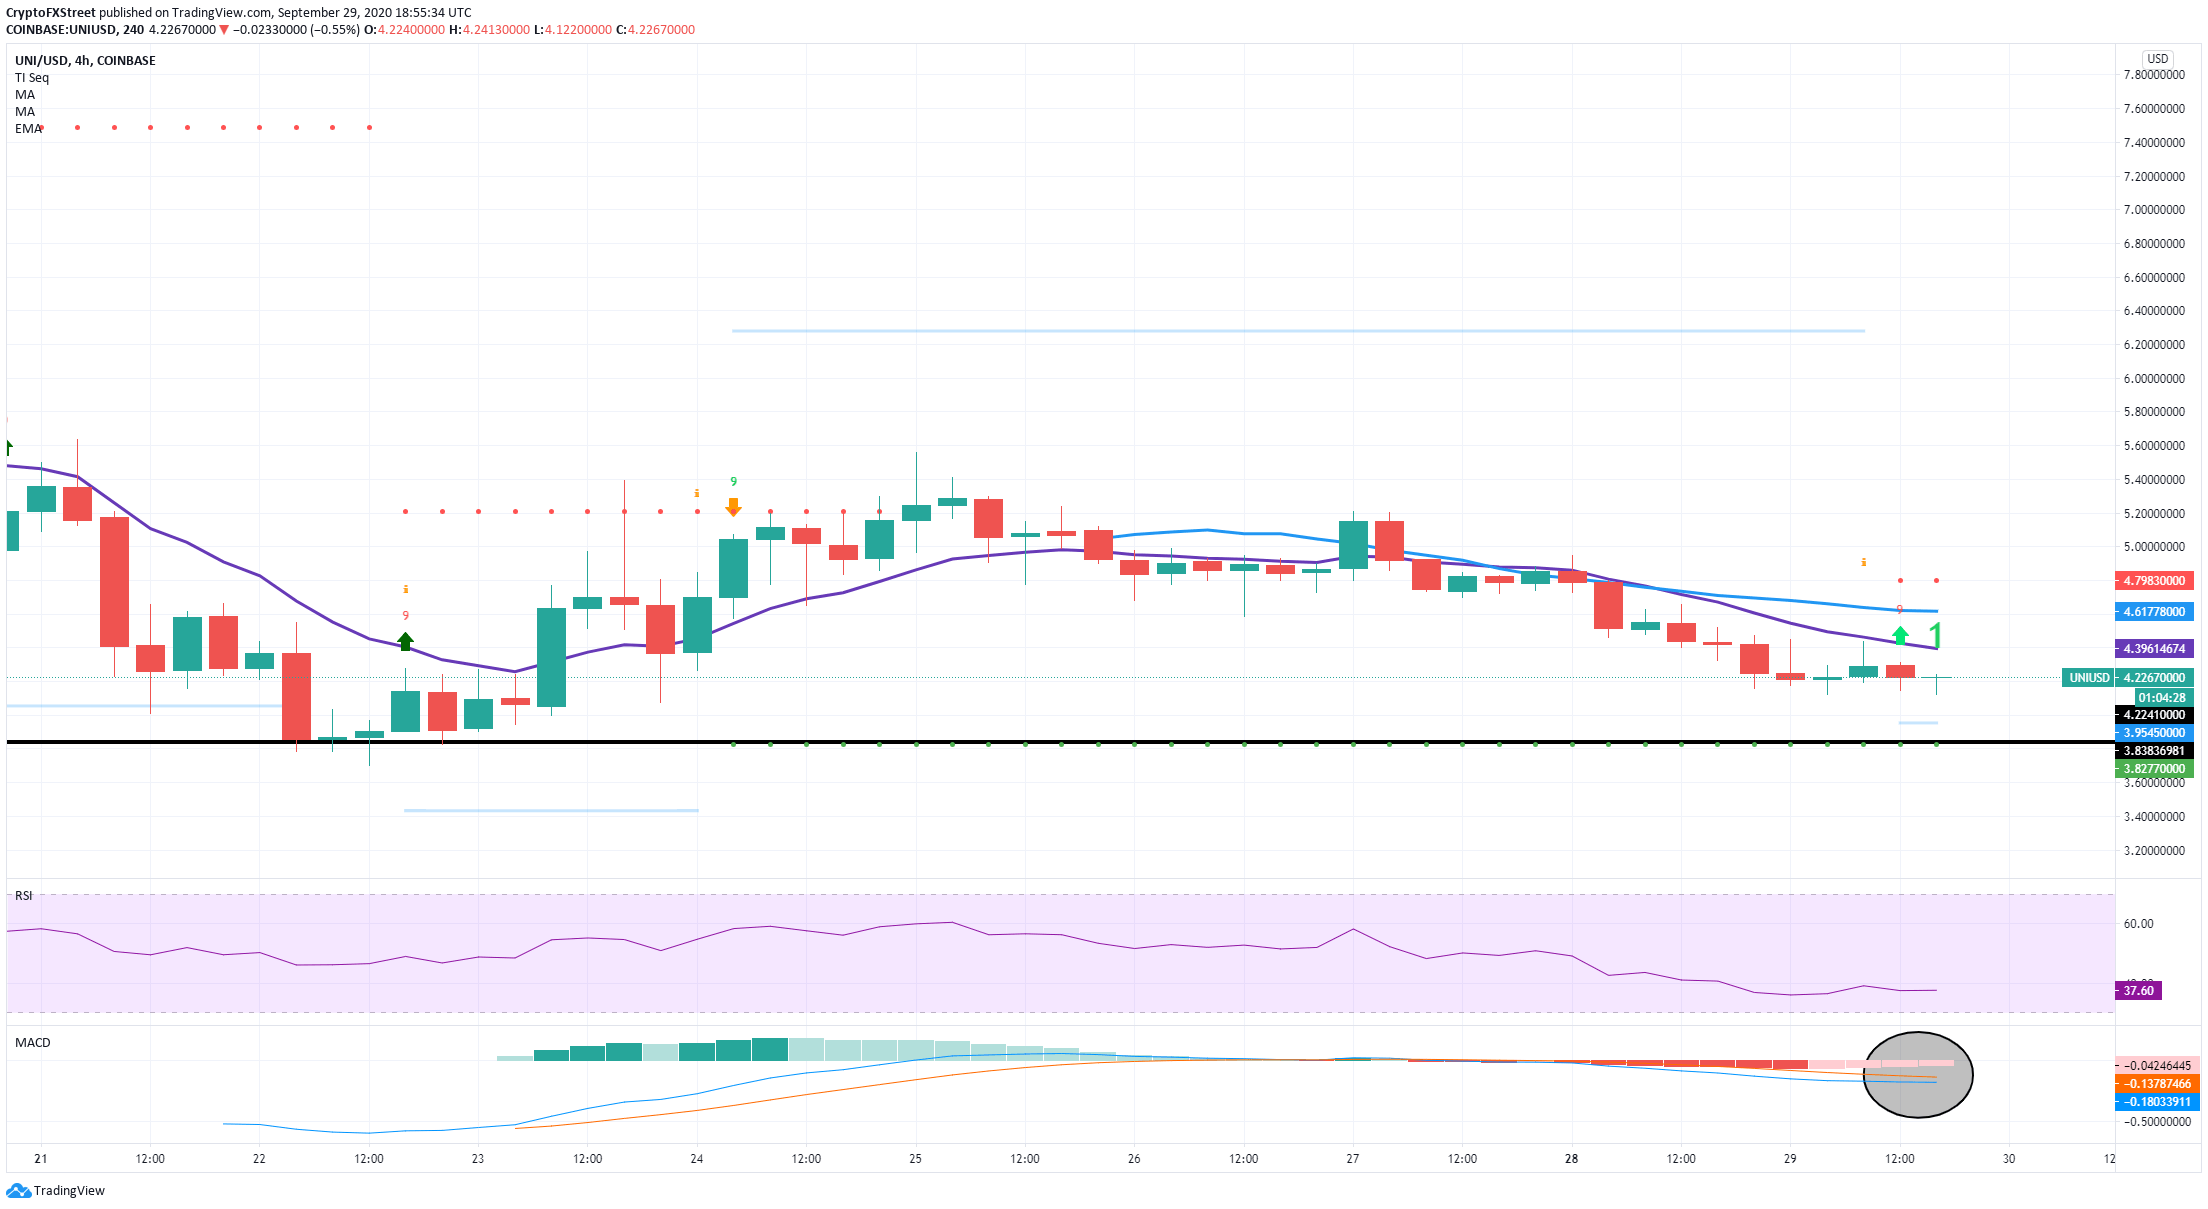
On the 4-hour chart, the TD sequential indicator has presented a buy signal around $4.2 which is now the nearest resistance level. Bulls are also facing some resistance in the form of the 12-EMA at $4.4. A bullish breakout above both levels will allow UNI price to target $4.6 where the 50-MA stands coinciding with the resistance area in the IOMAP chart. The MACD, although still bearish, it’s slowly shifting towards a bullish outlook.
UNI IOMAP Chart
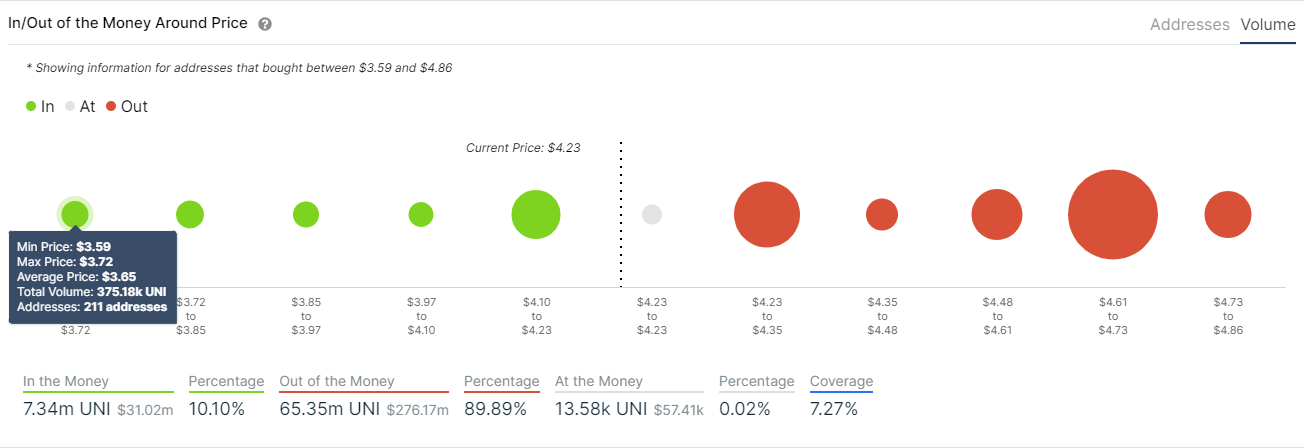
On the other hand, looking at the same IOMAP chart, we can observe that not many addresses bought UNI tokens below $4.1. The most crucial support level was established at $3.6, however, between $3.6 and $3.72, only 200 addresses bought 375,000 UNI tokens, which means there isn’t a lot of support for the digital asset around these levels.
A bearish breakout below $3.6 would be devastating for UNI as there aren’t many other support levels established below. The next bearish price target would be the $3 psychological level.
Author

Lorenzo Stroe
Independent Analyst
Lorenzo is an experienced Technical Analyst and Content Writer who has been working in the cryptocurrency industry since 2012. He also has a passion for trading.



