|

Uniswap Price Analysis: UNI draws diamond top pattern, nears breakout point

  • Uniswap price is bounded inside a diamond top pattern on the 12-hour chart.
  • Although UNI could be on the verge of a bearish reversal, the bullish outlook cannot be overlooked.

UNI is trading at $3.72 at the time of writing and it is contained inside a diamond top pattern on the 12-hour chart, a bearish indicator that usually shows the beginning of a reversal. However, given the current DeFi bullish momentum, it is entirely possible for Uniswap price to breakout.

Uniswap price faces two key levels before a breakdown or breakout

UNI is trading inside a diamond top pattern on the 12-hour chart, and it is on the verge of a breakout or breakdown. The lower trendline is established at $3.55, which means that a breakdown below this level would quickly push Uniswap price towards $2.5, a 30% move.

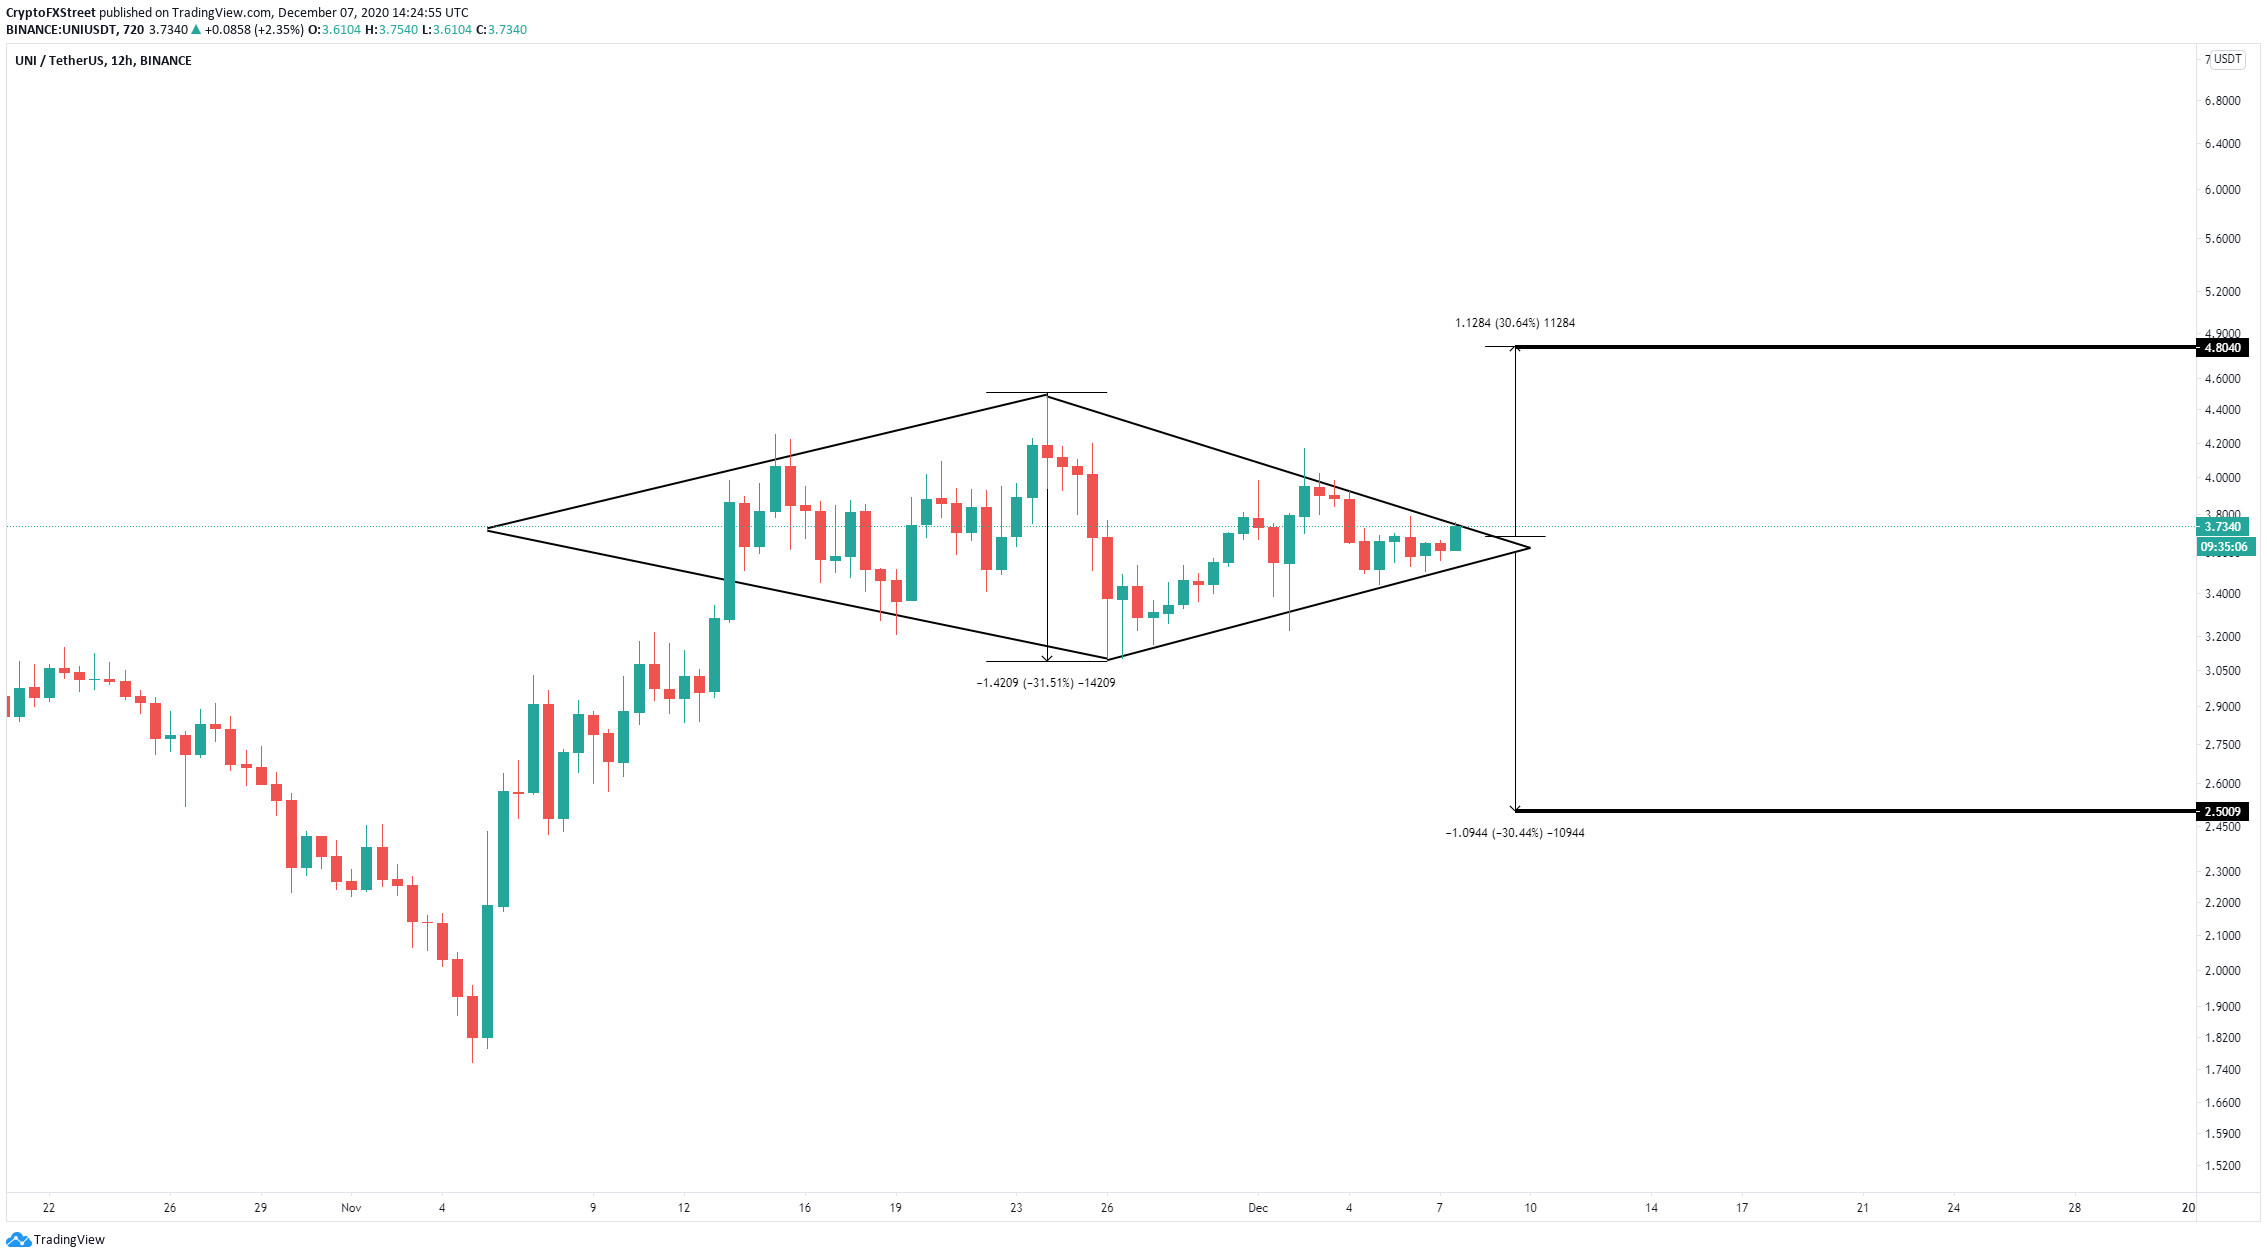
UNI/USD 12-hour chart

This seems to coincide with what the In/Out of the Money Around Price (IOMAP) chart shows, a substantial support area between $3.4 and $3.52 but almost nothing below these levels. 
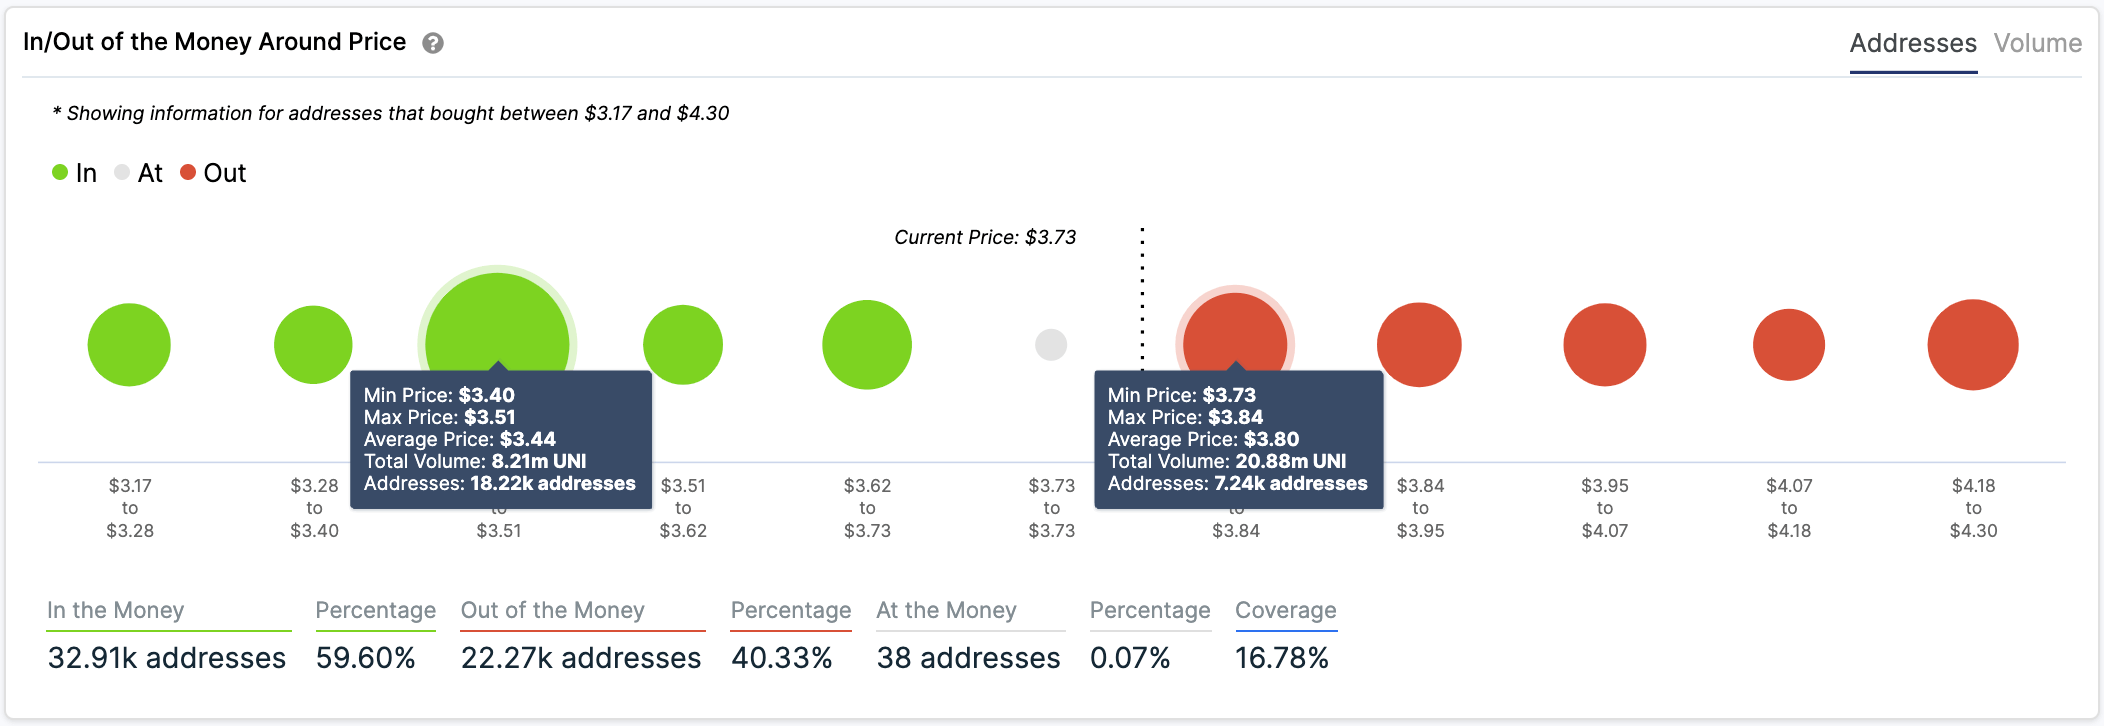
UNI IOMAP chart

On the other hand, the most significant resistance range is located between $3.73 and $3.84, where 7,240 addresses purchased 20.88 million UNI tokens. This area also coincides with the upper trendline of the diamond pattern. A breakout above this point would drive Uniswap price towards a price target of $4.8.

Author

Lorenzo Stroe

Lorenzo Stroe

Independent Analyst

Lorenzo is an experienced Technical Analyst and Content Writer who has been working in the cryptocurrency industry since 2012. He also has a passion for trading.

More from Lorenzo Stroe
Share:

Editor's Picks

Bitcoin and top cryptos plummet further as analyst terms market crash 'structural'

Bitcoin has declined below $65,000 on Thursday, down 11% over the past 24 hours. The move marks its largest decline since the October 10 leverage flush. Since then, the top crypto has erased more than 50% of its value since the October 10 leverage flush.

Ripple crashes below $1.40 as exchange reserves surge

Ripple is trading aggressively downward, while hovering at $1.37 at the time of writing on Thursday, reflecting a pristine risk-off mood across the crypto market. The remittance token is down nearly 10% intraday, weighed by intense volatility, retail investor exodus and declining institutional interest.

Crypto Today: Bitcoin, Ethereum, XRP tumble as retail dumps, risk-off mood prevails

Bitcoin holds above $70,000 after testing $69,922 intraday low amid a retail investor exodus. Ethereum is largely in bearish hands despite support at $2,000 staying intact.

Bitcoin Price Forecast: BTC nears $70,000 ahead of Strategy Q4 earnings

Bitcoin (BTC) price extends losses, nearing the $70,000 level at the time of writing on Thursday, erasing all gains since crypto-friendly candidate Donald Trump won the US presidential election in November 2024.

Bitcoin Price Annual Forecast: BTC holds long-term bullish structure heading into 2026

Bitcoin (BTC) is wrapping up 2025 as one of its most eventful years, defined by unprecedented institutional participation, major regulatory developments, and extreme price volatility.

Bitcoin: BTC correction deepens as Fed stance, US-Iran risks, mining disruptions weigh

Bitcoin (BTC) price extends correction, trading below $82,000 after sliding more than 5% so far this week. The bearish price action in BTC was fueled by fading institutional demand, as evidenced by spot Exchange-Traded Funds (ETFs), which recorded $978 million in inflows through Thursday.