UMA price is on the brink of a colossal breakout according to key pattern
- UMA price is contained inside a symmetrical triangle pattern on the 12-hour chart.
- The digital asset is ready for a 50% move towards new highs as bulls have the control.
- The number of whales holding UMA has significantly increased in the past weeks.

UMA has been trading inside a 12-hour uptrend and remains bullish awaiting a critical breakout above $26.4. The number of whales accumulating UMA tokens suggests that the digital asset is ready for new highs.
UMA price bounded for a massive breakout
On the 12-hour chart, UMA has created a symmetrical triangle pattern since the beginning of February. The key resistance trendline is formed at $26.4. A breakout above this point should push UMA price towards $40 in the long-term, pausing briefly at $30 and potentially at $34.
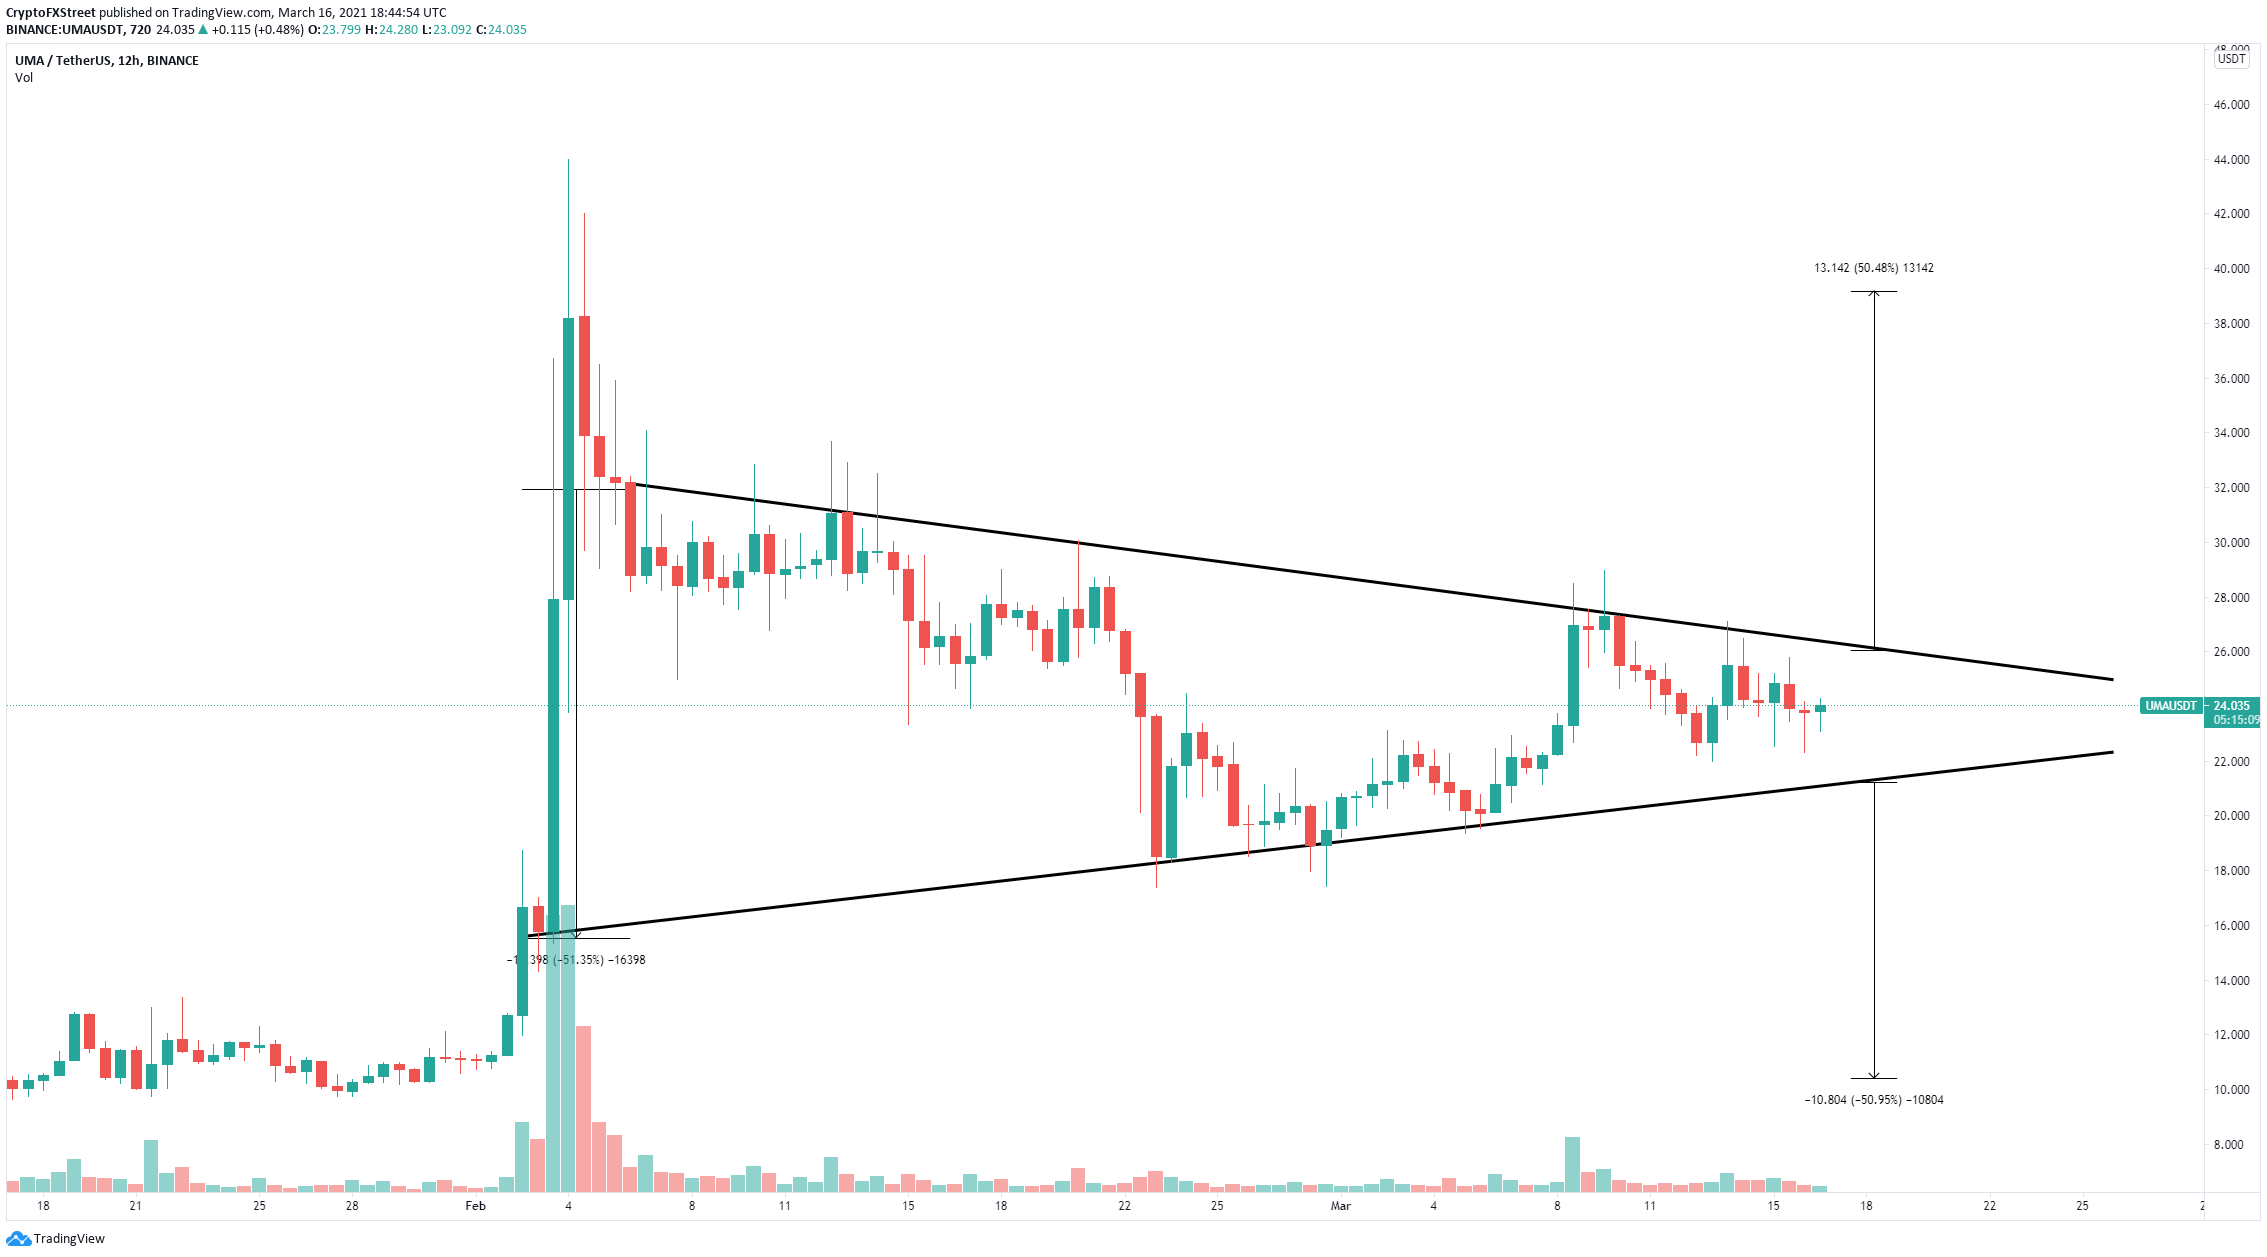
UMA/USD 12-hour chart
This scenario seems to be more likely as the number of whales holding between 10,000 and 100,000 tokens has increased by 21 since February 17. It indicates that large holders are accumulating UMA with the hopes of higher prices in the future.
%20[19.45.02,%2016%20Mar,%202021]-637515172303254041.png)
UMA Holders Distribution chart
Nonetheless, bears could still come back if they can push UMA below the key support trendline formed at $21.2. This would move the digital asset down to $17 and towards $10.5 in the long-term.
Author

Lorenzo Stroe
Independent Analyst
Lorenzo is an experienced Technical Analyst and Content Writer who has been working in the cryptocurrency industry since 2012. He also has a passion for trading.


