Share:
  • Tron price slips lower and is set to break firmly below the September lows. 
  • TRX price already printed a new low on Monday but closed above in a late-minute rally.
  • Should TRX price close below the September lows at $0.0599, expect to see a  continuation to the downside towards $0.0540.

Tron (TRX) price saw bulls coming in late during the Monday session, trying to eke out a full reversal of the price action and incurred losses. Unfortunately, they failed, although price action did still close above the important low of September at $0.0599. With TRX price heading to the downside again, and with bulls not having much incentive to place long bets – as the red descending trend line from the bearish triangle is still in play – expect to see another leg lower by the end of this week towards $0.0540.

TRX price set to drop 10%

Tron price is still moving within the boundaries of a bearish triangle that got identified at the top of August and saw tests on September 11th and 12th. Since then, price action has been running to the downside, with the low of September at $0.0599. Although bulls were able to buy the dip on Monday and push price action back above that level after it slipped below, the support has been broken and should flash red lights for bulls to get out now before TRX price tanks 10%.

TRX price will confirm the fear in case it closes below that $0.0599 marker this evening. Once that has happened, expect another move lower, with the monthly S1 at $0.0587 passed by quite quickly as TRX price will nosedive to $0.0540. Expect doubt and a possible turnaround as the old descending trendline in grey could trigger a bounce off with the low of March 25th from 2021 underpinning the price action.
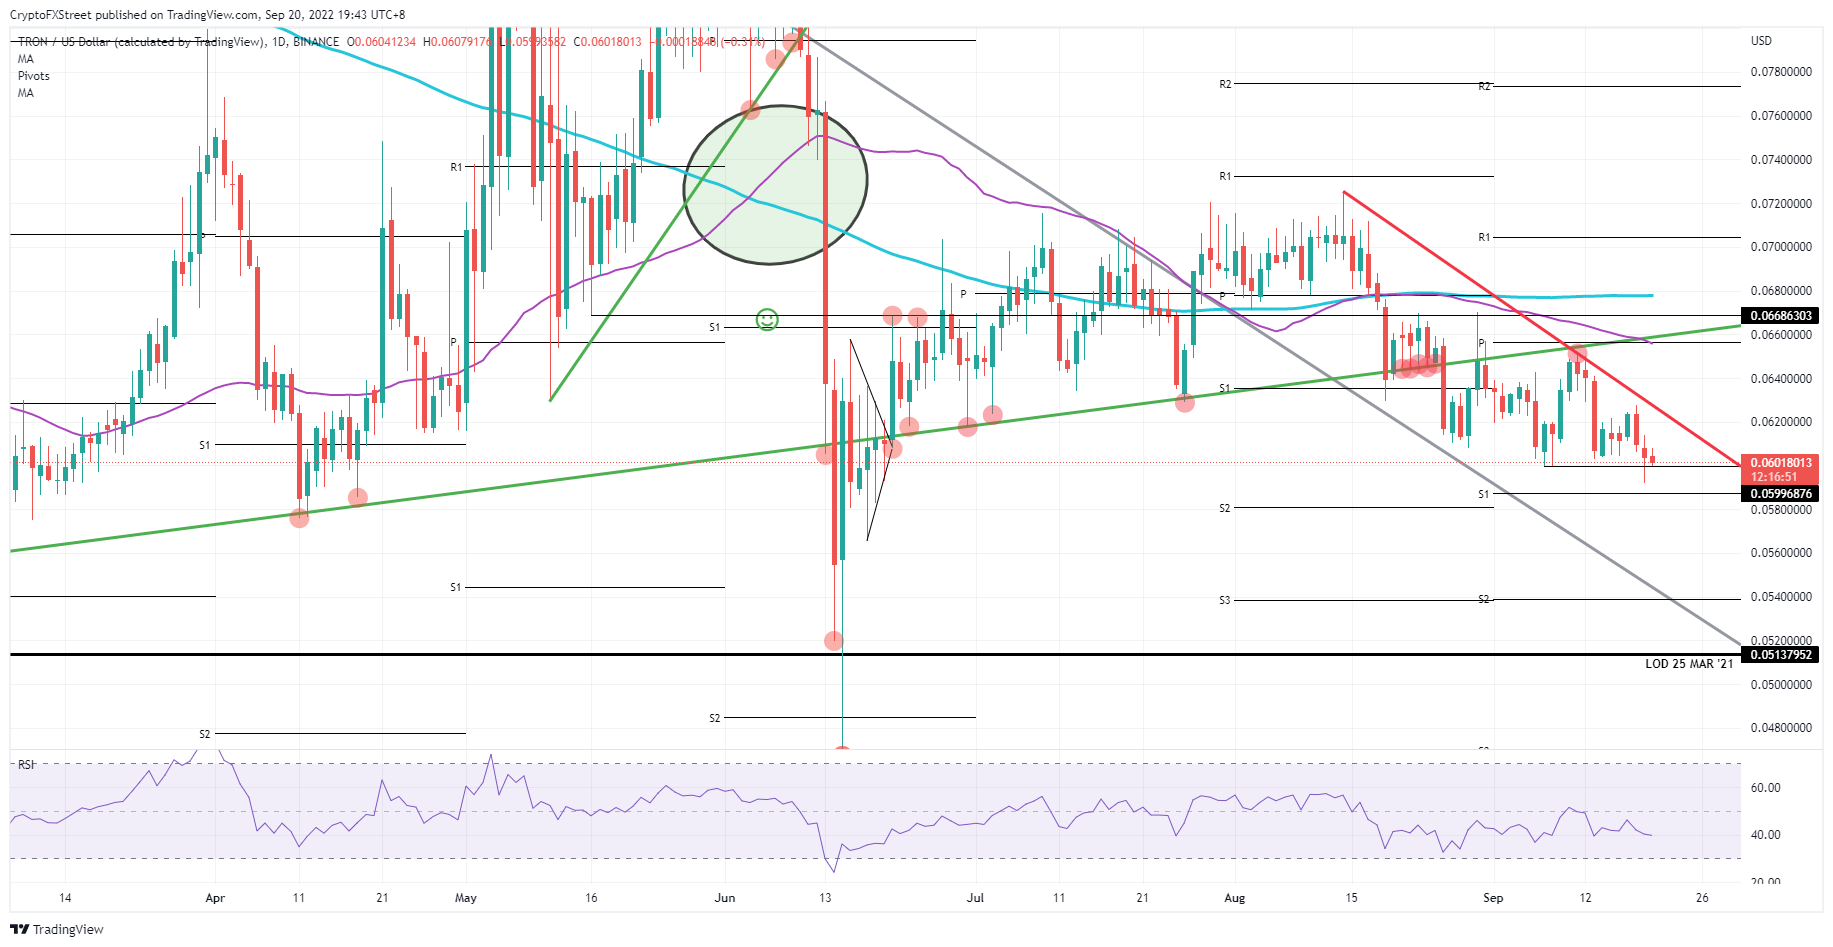
TRX/USD Daily chart

TRX/USD Daily chart

Although highly unlikely, a countermove to the upside could still be in the cards. A few shock effects could occur in the market as this week, there are over four big central banks coming out with rate decisions. Each meeting could be a catalyst that pushes price action to the upside, with TRX price set to pierce through the descending side of the bearish triangle and stretching to $0.066, where the monthly pivot and the 55-day Simple Moving Average reside. 


Information on these pages contains forward-looking statements that involve risks and uncertainties. Markets and instruments profiled on this page are for informational purposes only and should not in any way come across as a recommendation to buy or sell in these assets. You should do your own thorough research before making any investment decisions. FXStreet does not in any way guarantee that this information is free from mistakes, errors, or material misstatements. It also does not guarantee that this information is of a timely nature. Investing in Open Markets involves a great deal of risk, including the loss of all or a portion of your investment, as well as emotional distress. All risks, losses and costs associated with investing, including total loss of principal, are your responsibility. The views and opinions expressed in this article are those of the authors and do not necessarily reflect the official policy or position of FXStreet nor its advertisers. The author will not be held responsible for information that is found at the end of links posted on this page.

If not otherwise explicitly mentioned in the body of the article, at the time of writing, the author has no position in any stock mentioned in this article and no business relationship with any company mentioned. The author has not received compensation for writing this article, other than from FXStreet.

FXStreet and the author do not provide personalized recommendations. The author makes no representations as to the accuracy, completeness, or suitability of this information. FXStreet and the author will not be liable for any errors, omissions or any losses, injuries or damages arising from this information and its display or use. Errors and omissions excepted.

The author and FXStreet are not registered investment advisors and nothing in this article is intended to be investment advice.

Join Telegram

Follow us on Telegram

Stay updated of all the news

Join Telegram

Recommended content


Follow us on Telegram

Stay updated of all the news

Join Telegram

Recommended Content

Editors’ Picks

Top 5 tokens trending alongside Bitcoin: ORDI, STX, LUNC, PEPE, CFX

Top 5 tokens trending alongside Bitcoin: ORDI, STX, LUNC, PEPE, CFX

Bitcoin price crossed the $41,400 level early on Tuesday. The largest cryptocurrency by market capitalization extended its gains and continued its rally, after yielding 12% weekly gains for holders.

More Cryptocurrencies News

There is a 25% probability of Solana flipping Ethereum: Santiago Santos

There is a 25% probability of Solana flipping Ethereum: Santiago Santos

In a recent episode of the Empire podcast, Santiago Santos, former Partner at ParaFi Capital, shares his views on how Solana’s market capitalization could exceed Ethereum’s in the next market cycle.

More Solana News

Ripple transaction count exceeds 1.38 million, XRP price likely to extend gains

Ripple transaction count exceeds 1.38 million, XRP price likely to extend gains

Ripple (XRP) remains a talking point among retail market participants that expect a settlement in the US Securities and Exchange Commission’s (SEC) lawsuit against the cross-border payment remittance firm.

More Ripple News

Bitcoin price eyes $45,000 target ahead of BTC halving in April 2024

Bitcoin price eyes $45,000 target ahead of BTC halving in April 2024

Bitcoin price crossed the $41,400 mark on Binance, in its ongoing uptrend, on December 5. BTC price rally is likely driven by the anticipation of Spot Bitcoin ETF approval. There are more catalysts driving BTC price gains in the current cycle.

More Bitcoin News

Analyzing potential $30k corrections ahead of BTC ETF approval

Analyzing potential $30k corrections ahead of BTC ETF approval

Bitcoin has slowed down its 2023 bull rally as it approaches the $37,000 level. After three weeks of consolidating around this level, BTC shows no directional bias whatsoever. Some investors speculate this could be an upward-sloping accumulation that leads to a $40,000 rally.

Read full analysis

BTC

ETH

XRP