TRON Price Prediction: TRX eying up $0.031, but is facing significant resistance
- TRX is currently trading at $0.026 after a massive bull rally towards $0.05.
- The breakout of a critical pattern will determine the direction of TRX in the short-term.

After coming up with its own DeFi project, SUN mining, the price of TRX exploded to $0.05. It is now trading at $0.026.
Can TRX crack this critical resistance area?
On the daily chart, a significant resistance level was established at $0.027 and tested twice on September 26 and October 3.
TRX/USD daily chart
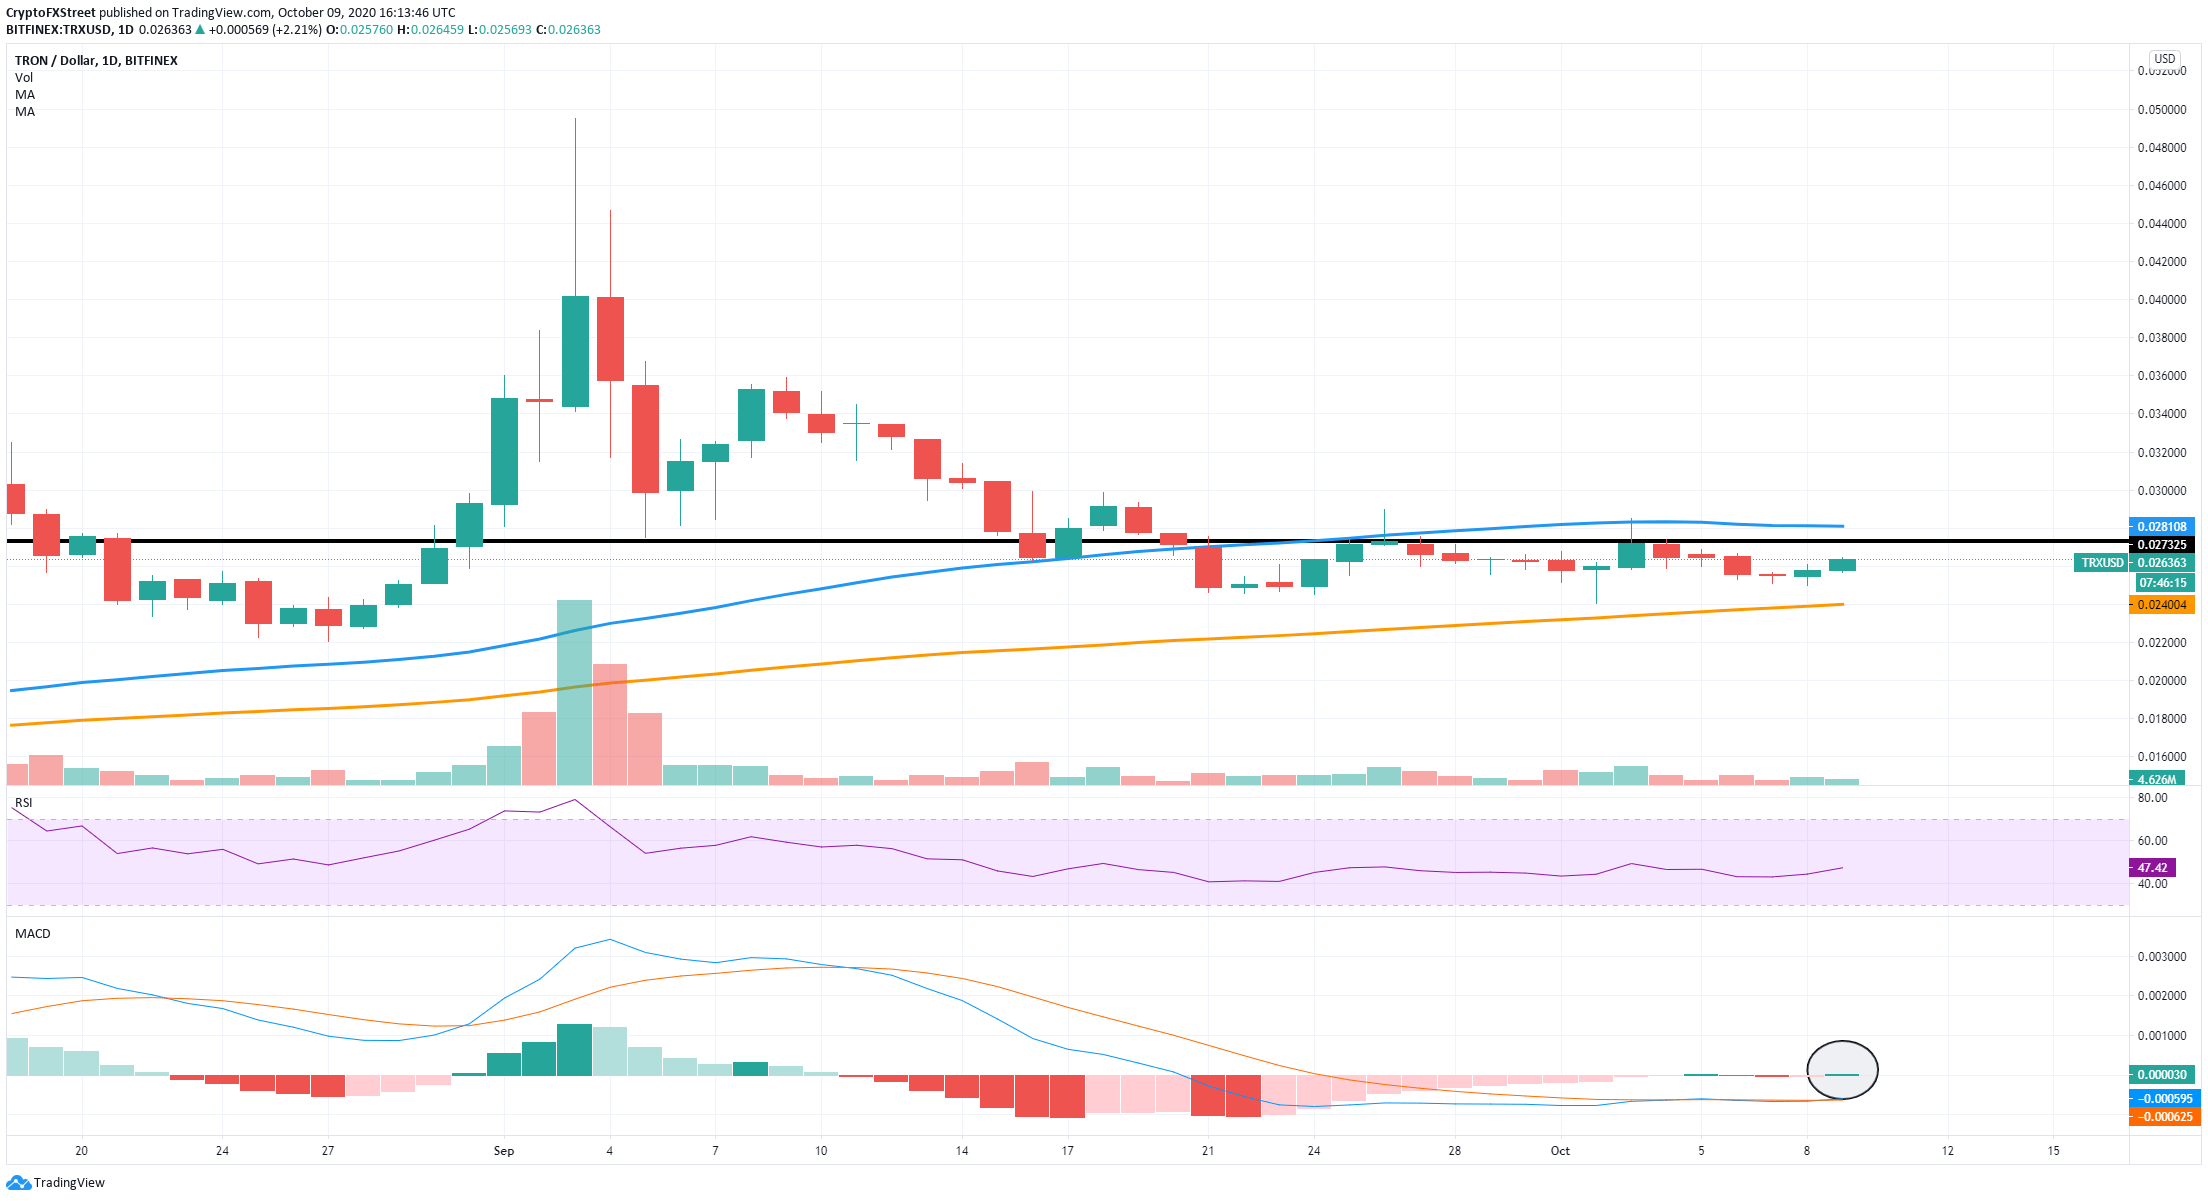
The 50-SMA has also been acting as a strong resistance point, rejecting the price several times in the past. On the other hand, TRX has been able to maintain the 100-SMA as a support level and the MACD just turned bullish, which is usually an indicator of a big move upwards, like it happened back on August 31.
TRX/USD 12-hour chart
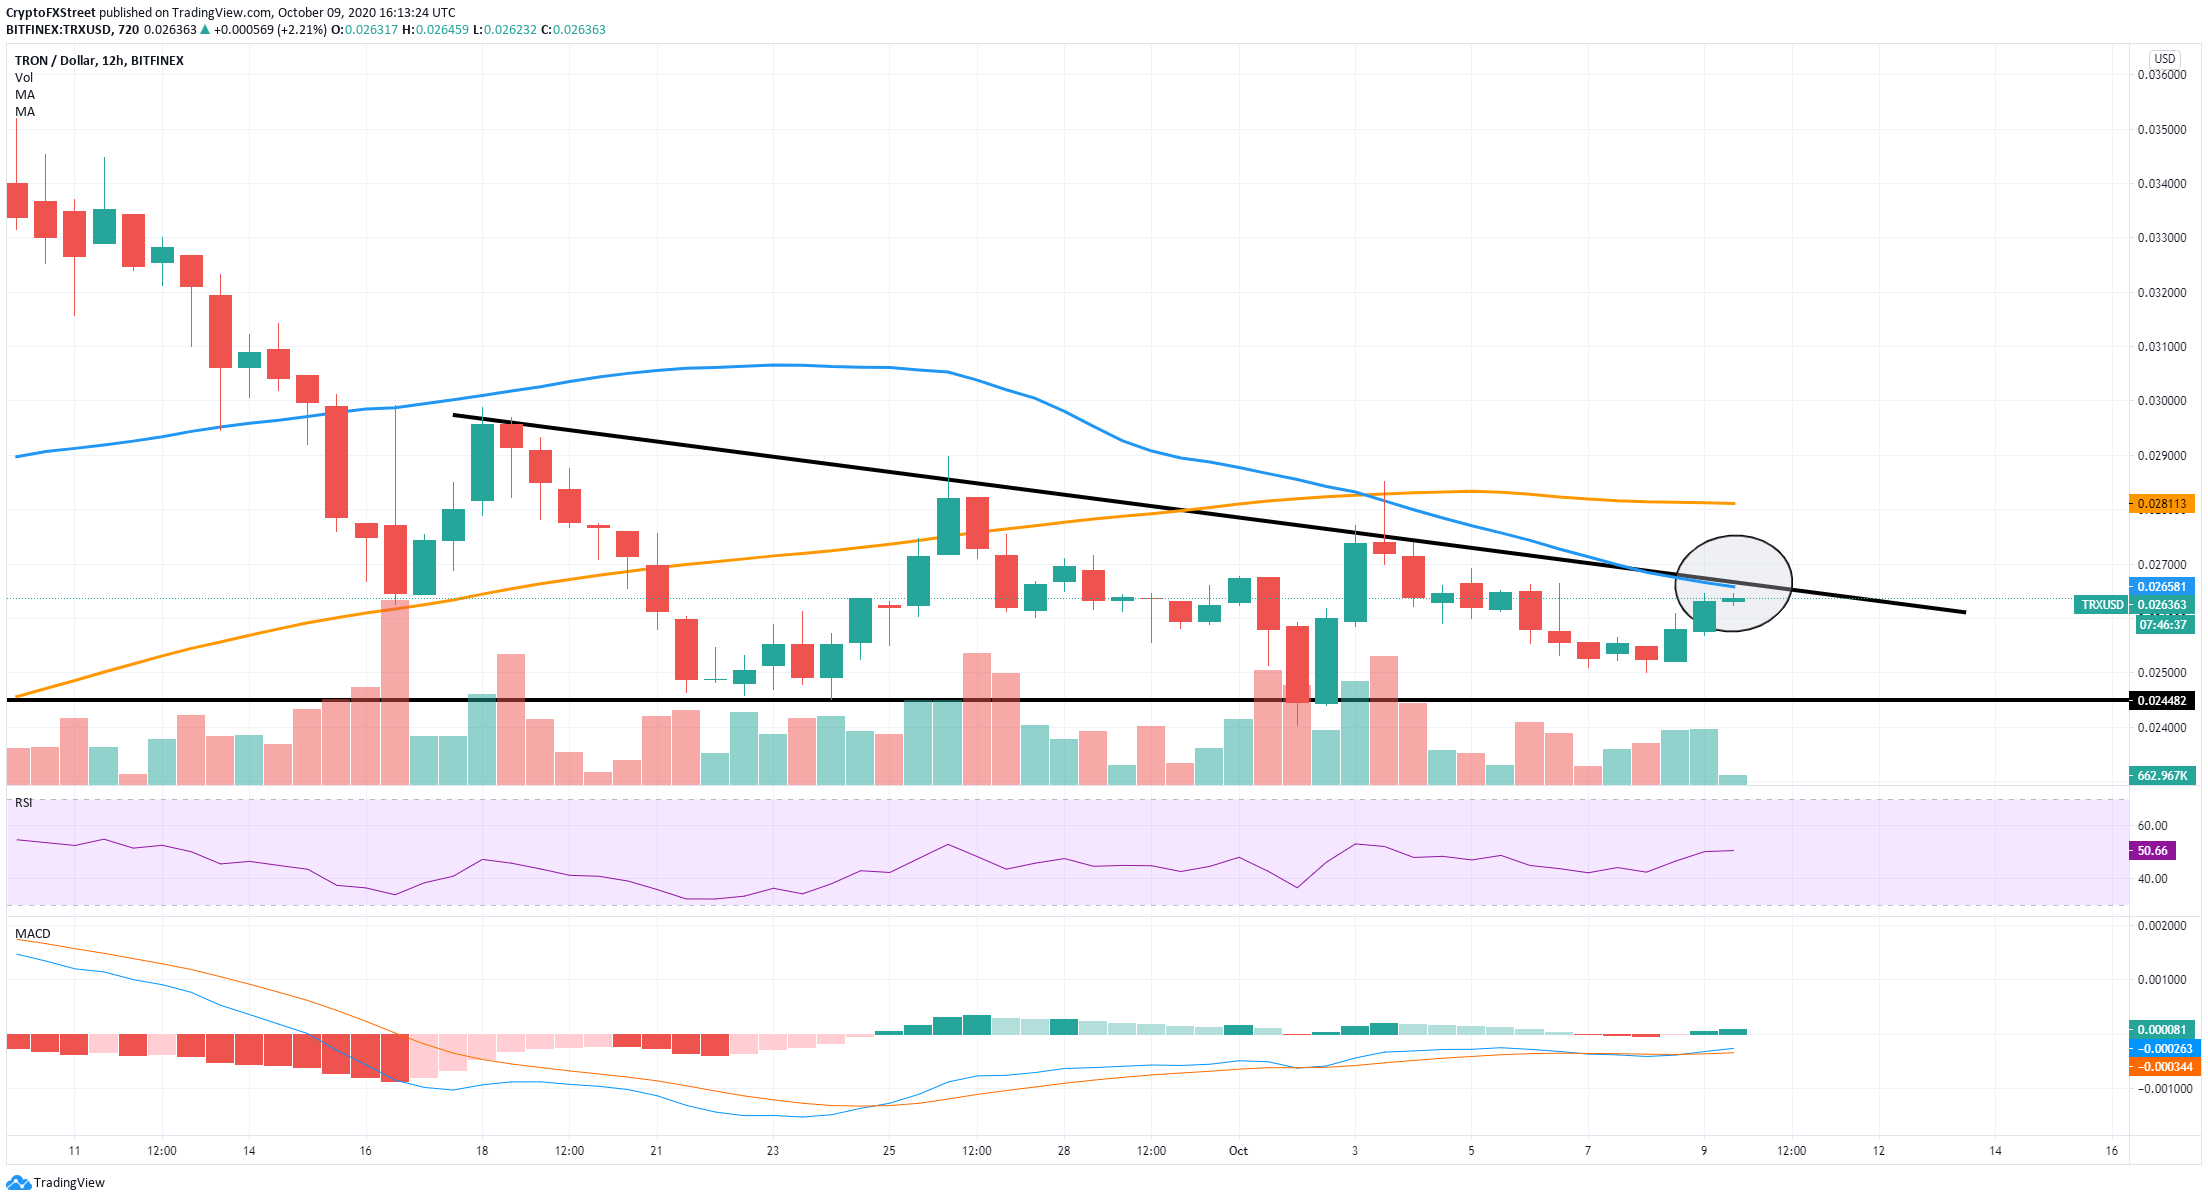
On the 12-hour chart, the price has formed what seems to be a descending triangle pattern, forming a support level at $0.024. The upper boundary of this pattern is currently around $0.026, which coincides with the 50-SMA on the 12-hour chart.
A bullish breakout above both levels would impulse TRX up to at least $0.028 where the 100-SMA currently stands on the 12-hour chart.
However, a rejection from the 50-SMA on the 12-hour chart and the upper trendline of the descending triangle pattern has the potential to drop the price of TRX to at least the support line at $0.024.
Below this support point, the price could fall down to $0.022 if the bearish momentum is strong enough.
Author

Lorenzo Stroe
Independent Analyst
Lorenzo is an experienced Technical Analyst and Content Writer who has been working in the cryptocurrency industry since 2012. He also has a passion for trading.


