|

Tron Technical Analysis: TRX flashes sell sign in 4-hour chart, despite long-term bullish outlook

  • TRX/USD 3-day chart has formed the bullish golden cross pattern.
  • The 12-hour chart MACD has reversed from bearish to bullish.

Tron’s 3-day chart has had a bullish session after five straight red sessions. However, there is one more sign that shows that this isn’t a one-time occurrence.

TRX/USD 3-day chart

TRXUSD 12-hour chart

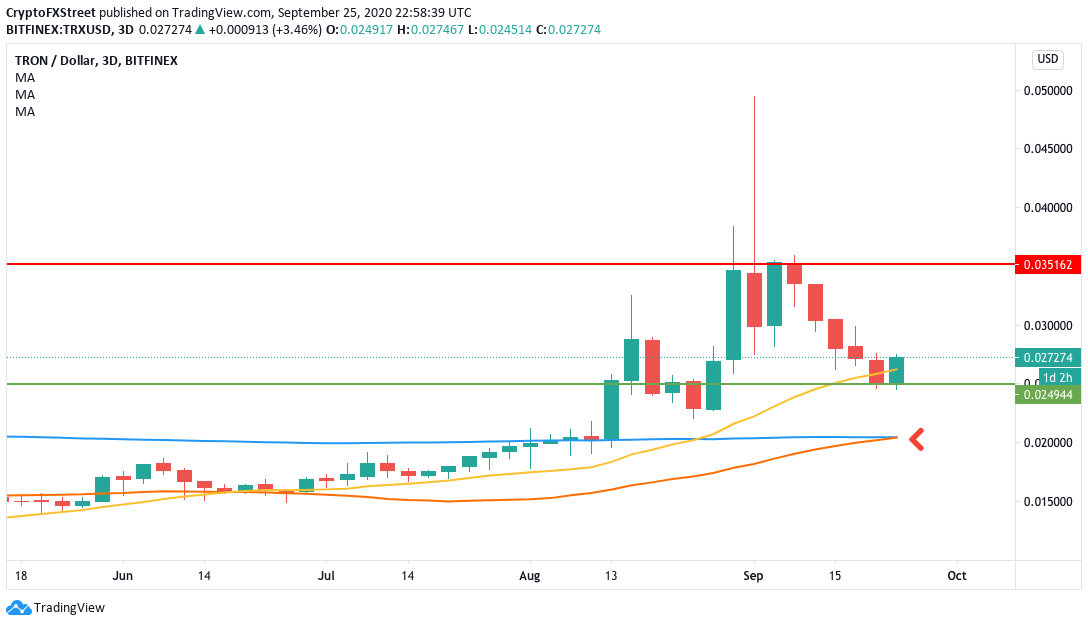
The SMA 50 has touched the SMA 200 and is about to completely cross over to chart the heavily bullish golden cross pattern. This means that more bullish growth is expected. However, how much is the upside potential? Let’s check out some smaller time frames.

TRX/USD 12-hour chart

TRXUSD 12-hour chart

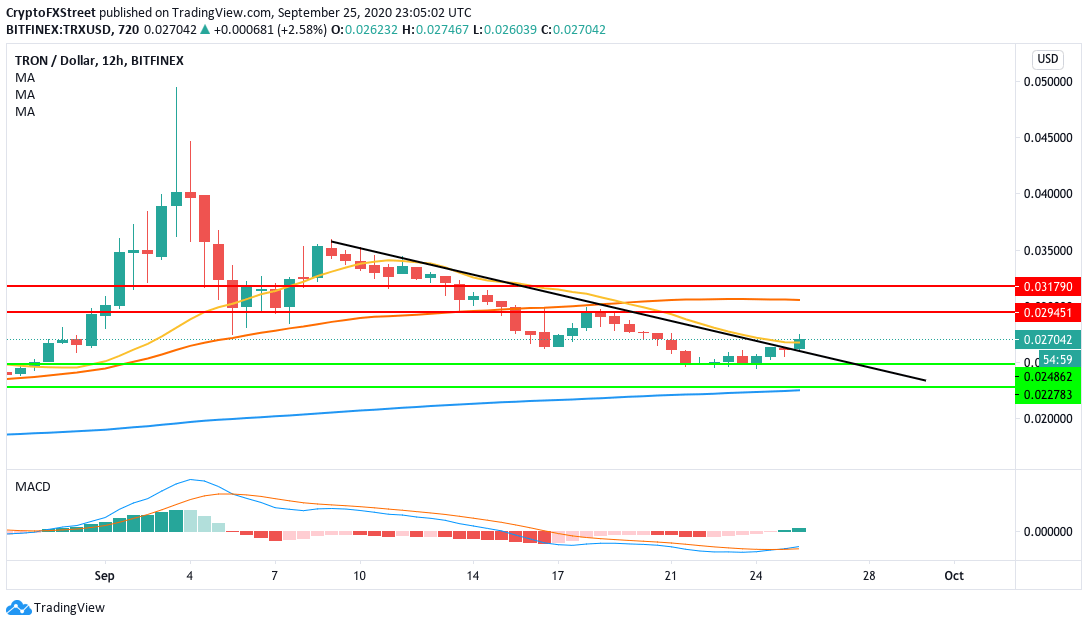
TRX/USD has had a bullish breakout from the descending triangle formation. In the process, it seems to have broken above the SMA 20 curve. The MACD has shifted market momentum from bearish to bullish. Ideally speaking, the price will want to break above the $0.02945 resistance level to make the most out of this bullish momentum.

However, does the price have what it takes to actually break past these levels? For that, let’s constrict our timeframe some more.

TRX/USD 4-hour chart

TRXUSD 4-hour chart

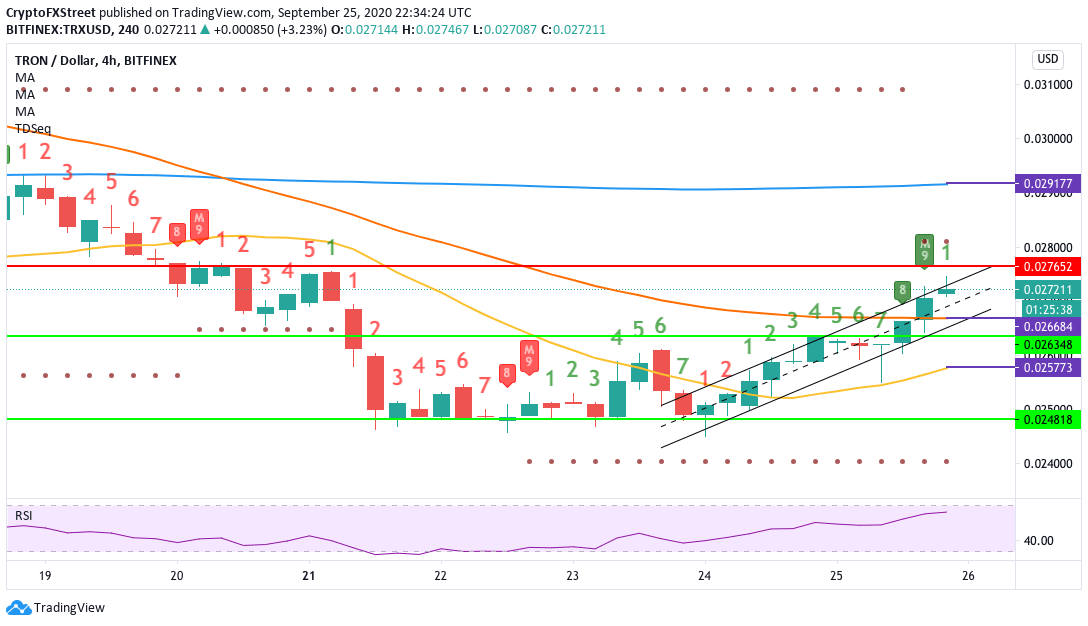
TRX/USD has flashed the TD sequential sell signal and is trending in a flag formation. If the buyers somehow manage to reverse the trend, the RSI will creep into the overbought zone, which will usher in a bearish correction anyway. However, if the price does experience a bearish correction in the short-term, the SMA 50 curve must hold firm to prevent further downtrend.

So, while the price may face a short-term bearish correction to $0.0264, the long-term outlook still looks positive.
 

Author

Rajarshi Mitra

Rajarshi Mitra

Independent Analyst

Rajarshi entered the blockchain space in 2016. He is a blockchain researcher who has worked for Blockgeeks and has done research work for several ICOs. He gets regularly invited to give talks on the blockchain technology and cryptocurrencies.

More from Rajarshi Mitra
Share:

Markets move fast. We move first.

Orange Juice Newsletter brings you expert driven insights - not headlines. Every day on your inbox.

By subscribing you agree to our Terms and conditions.

Editor's Picks

Ripple faces persistent bear risks, shrugging off ETF inflows

Ripple is extending its decline for the second consecutive day, trading at $2.06 at the time of writing on Friday. Sentiment surrounding the cross-border remittance token continues to lag despite steady inflows into XRP spot ETFs. 

Luna Classic soars 20% as Do Kwon's sentence hearing looms

Luna Classic surges 20% on Friday, extending its recovery for the fourth consecutive day. Roughly 959 million tokens have been burned in December so far, fueling LUNC's recovery.

Crypto Today: Bitcoin, Ethereum, XRP pare gains despite increasing hopes of upcoming Fed rate cut

Bitcoin (BTC) is steadying above $91,000 at the time of writing on Friday. Resistance at $94,150 capped recovery on Wednesday, but in the meantime, bulls have contained downside risks above $90,000. 

Ethereum strengthens against BTC post-Fusaka, targeting $3,200 breakout

Ethereum trades above $3,100 on Friday, with bulls aiming for a breakout above a two-month-old resistance trendline. Ethereum gains strength against Bitcoin as demand for the major altcoin increases after the Fusaka upgrade.

Orange Juice Newsletter – Smart insights by real people. Every day.

A free newsletter highlighting key market trends to help traders stay a step ahead. Daily insights on the most relevant trading topics, compiled by our experts in an easy-to-read format so you never miss an important move.

Crypto Today: Bitcoin, Ethereum, XRP pare gains despite increasing hopes of upcoming Fed rate cut

Bitcoin (BTC) is steadying above $91,000 at the time of writing on Friday. Resistance at $94,150 capped recovery on Wednesday, but in the meantime, bulls have contained downside risks above $90,000.