TRON price faces major resistance at these levels, is a sucker's rally underway?
- TRON price has rallied by 20% after losing 30% of market value in November.
- TRX has hurdled significant resistance levels but is near an ideal profit-taking Fibonacci retracement level.
- A breach above $0.057 could induce a rally toward the November high at $0.065.

TRON price (TRX) has retaliated considerably against the bearish onslaught in November. Despite the optimistic gesture, TRX price still faces significant barriers of resistance. Traders should consider trading more conservatively near the current price levels.
TRON price stair-steps north
TRON price has shown applaudable market strength compared to most altcoins. Since the newfound yearly low at $0.045 was established on November 14, the bulls have progressively produced higher lows and higher highs. Currently, the TRX price is up 20% post-decline.
TRX price currently trades at $0.054. The bulls have hurdled an 8-day exponential moving average and a 21-day simple moving average (SMA) during the recent ascension. A Fibonacci retracement tool surrounding November's downtrend shows the current price at the 50% Fib level. The 50% and 61.8% Fib levels are usually where knife-catching bulls aim to release and offload their positions. Given the context, TRX could have difficulty maintaining the bullish momentum during the current rally.
Early signs of an uptrend failure would be a breach below the 21-day SMA at $0.052. The inability to sustain support from the indicator could lead to a 17% liquidation event targeting the newfound monthly low at $0.045.
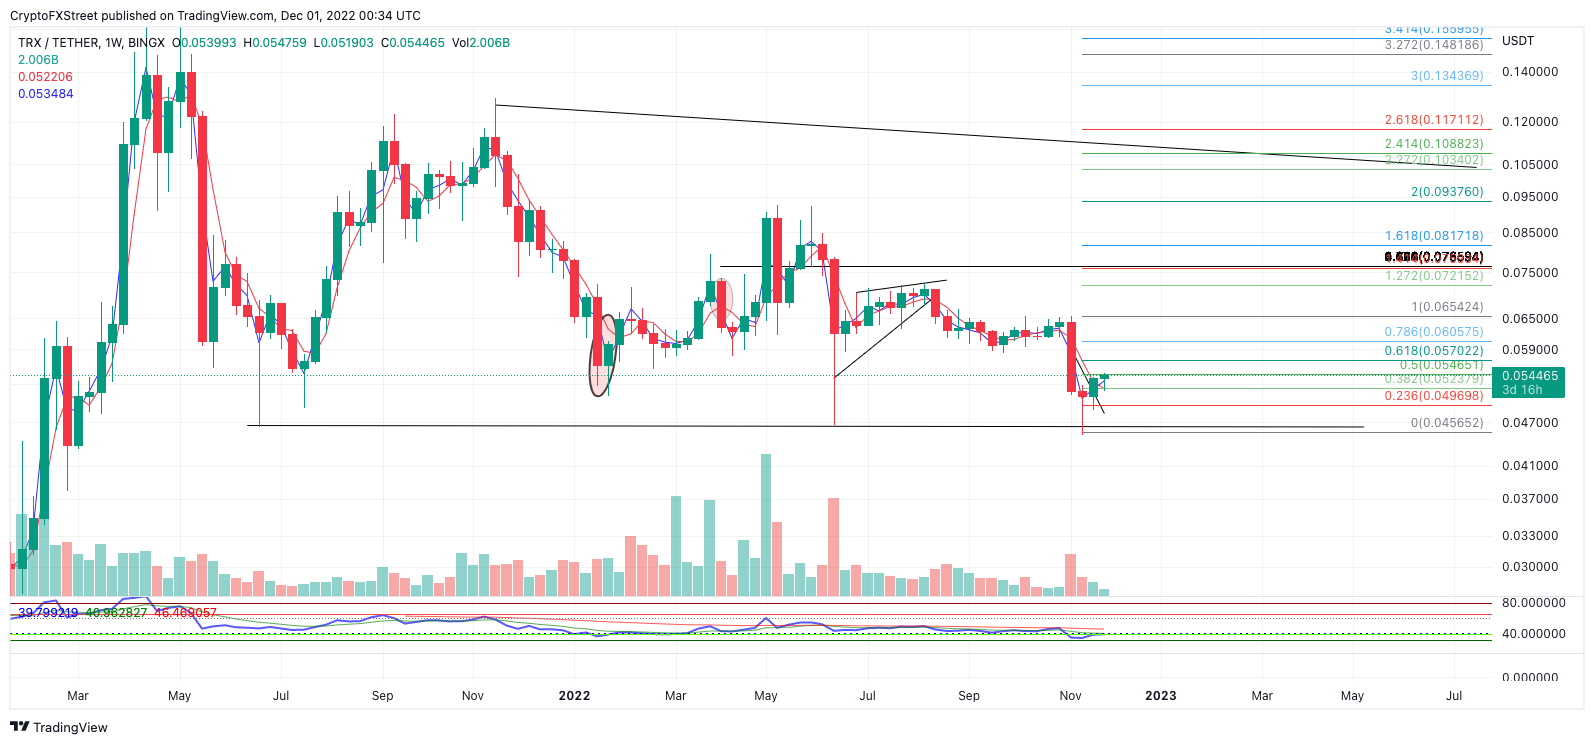
TRX/USDT 1-week chart
This thesis suggests TRX will likely find significant pushback from the current price levels, with a cap on the uptrend rallying 5% above the current market value at $0.057. If the bulls can flip the aforementioned level into support, they could be able to challenge the November highs at $0.065. Such a move would result in a 20% increase from the current TRON price.
Here's how Bitcoin price moves could affect TRON price
Author

Tony M.
FXStreet Contributor
Tony Montpeirous began investing in cryptocurrencies in 2017. His trading style incorporates Elliot Wave, Auction Market Theory, Fibonacci and price action as the cornerstone of his technical analysis.


