- SafeMoon price intraday looks promising.
- Nevertheless, SFM price has been struggling to close above the 55-day SMA, so traders should act with caution.
- An initial pullback may eventually lead to gains as the market soft patch could end this week.
SafeMoon (SFM) price looks promising today for a pop higher and a test of the technical moving average at around $0.000600000. With the current soft patch in global markets, tail risks are still very much present and could flare up at any moment, triggering a violent turnaround with risk sentiment shifting back to safe havens and away from cryptocurrencies. SFM price will probably fail to close above the technical moving average and trigger a drop back to $0.00050000 as price action consolidates towards a breakout later this week.
SFM price set to consolidate within this soft patch
SafeMoon price could jump and hit $0.000600000 in the coming trading session as bulls try to retest the 55-day Simple Moving Average (SMA), as happened in previous days. The risk, however, is that bulls remain in their positions for too long and get washed out as price action retraces lower and bears come in to defend with everything they have got. A daily close above the MA would be a necessary prerequisite for further rallies in SFM price, but the additional 61.8% Fibonacci level could cap further progress and be a bridge too far.
SFM price holds roughly 10% hypothetical gains before it hits that 55-day SMA. As it rises, the Relative Strength Index (RSI) will get dragged higher, limiting further upside potential. Add to that the mentioned pressure from the 61.8% Fibonacci level at $0.000611824, and a double belt of resistance is identified.
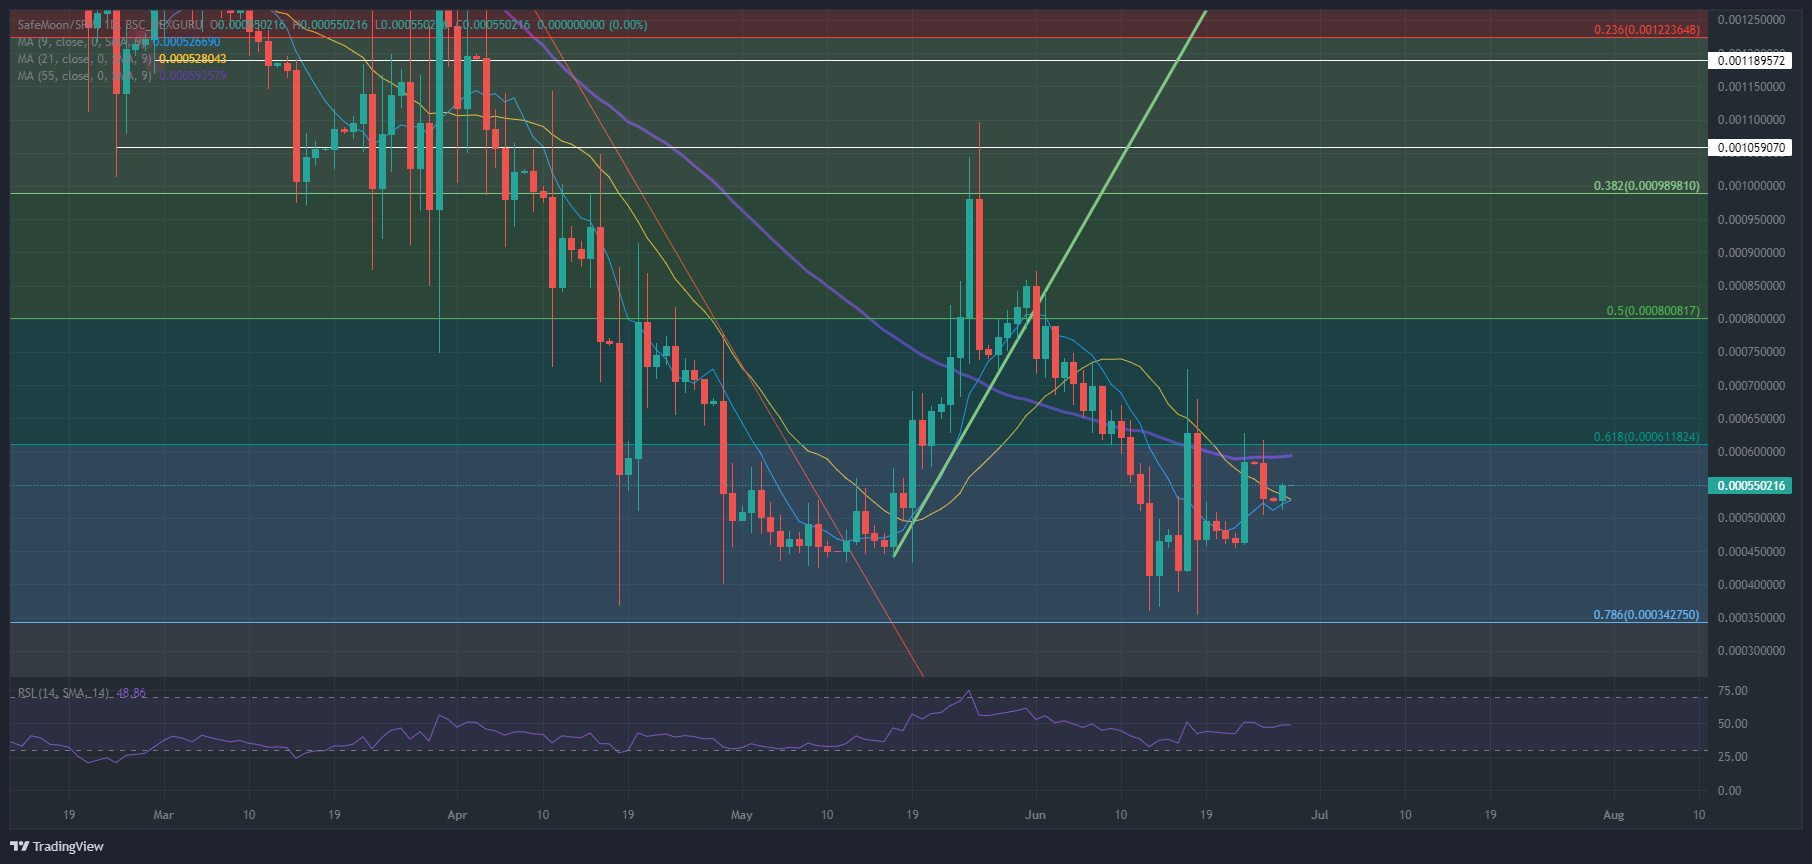
SFM/USD daily chart
Downside risks come from markets speculating that peak inflation has been reached and a recession is on the way. A few data releases from last week showed signs that a recession is potentially coming closer, with sentiment numbers in manufacturing and services dropping but consumer confidence still elevated. Should economic data this week further confirm that narrative, expect to see the rough patch quickly reverse with markets in a cramp again and SFM price dropping from its current position towards $0.000500000. There is even the possibility that SafeMoon price could slide lower on a risk-off wave towards $0.000342750 and the 78.6% Fibonacci level, coming in as a safety net below.
Information on these pages contains forward-looking statements that involve risks and uncertainties. Markets and instruments profiled on this page are for informational purposes only and should not in any way come across as a recommendation to buy or sell in these assets. You should do your own thorough research before making any investment decisions. FXStreet does not in any way guarantee that this information is free from mistakes, errors, or material misstatements. It also does not guarantee that this information is of a timely nature. Investing in Open Markets involves a great deal of risk, including the loss of all or a portion of your investment, as well as emotional distress. All risks, losses and costs associated with investing, including total loss of principal, are your responsibility. The views and opinions expressed in this article are those of the authors and do not necessarily reflect the official policy or position of FXStreet nor its advertisers. The author will not be held responsible for information that is found at the end of links posted on this page.
If not otherwise explicitly mentioned in the body of the article, at the time of writing, the author has no position in any stock mentioned in this article and no business relationship with any company mentioned. The author has not received compensation for writing this article, other than from FXStreet.
FXStreet and the author do not provide personalized recommendations. The author makes no representations as to the accuracy, completeness, or suitability of this information. FXStreet and the author will not be liable for any errors, omissions or any losses, injuries or damages arising from this information and its display or use. Errors and omissions excepted.
The author and FXStreet are not registered investment advisors and nothing in this article is intended to be investment advice.
Recommended Content
Editors’ Picks
Ripple's move above this key level could trigger nearly 50% rally for XRP
Ripple has overcome a critical resistance level and flipped into a support floor on the weekly time frame. This development happened while XRP tightly consolidated for roughly 250 days. Investors can expect XRP to kickstart a massive rally.
Optimism price outlook with nearly $90 million worth of OP tokens flooding markets on Friday
Optimism volatility has shrunk in the ours leading to the network’s cliff unlock. It joins the likes of dYdX and Sui, which have similar events on their calendars. As token unlocks are often considered bearish catalysts, investors should brace for a reaction after the event.
Top 3 Price Prediction Bitcoin, Ethereum, Ripple: Retail watches from the sidelines with a bias for shorts
Bitcoin could clear $73,777 peak as BTC bulls resurface. Ethereum might fall 10% before next leg up as ETH RSI teases with sell signal. XRP could lose $0.6000 threshold as Ripple bulls fail to show up.
Jito price could hit $6 as JTO coils up inside this bullish pattern
Jito price action shows a potential cup and handle formation. Based on theoretical measurement rules, a successful breakout could yield a 56% rally to $6.0. A breakdown of the $3.86 support level would create a lower low for JTO and invalidate the bullish thesis.
Bitcoin: BTC may have recovered, but is it out of the woods?
Bitcoin’s (BTC) upward momentum has shown a significant decline for the past two weeks or so. This development led to a bearish signal on the weekly and an uncertain outlook on the monthly.