Top Gainers VIRTUALS, CAKE, INJ: Altcoins soar with new features and trading volume surge
- Virtuals Protocol soars 14% on Tuesday, with the TP cooldown history feature going live.
- PancakeSwap's trading volume soars as token burning fuels demand.
- Injective’s central limit order book grows in tandem with increased iAssets trading volume, and total transactions surpass 2 billion.

The broader cryptocurrency market maintains an upbeat trend with altcoins leading the recovery as Bitcoin (BTC) takes a breather at $108k. Top gainers, such as Virtuals Protocol (VIRTUAL), PancakeSwap (CAKE), and Injective Protocol (INJ), dominate the chart, driven by either feature upgrades or a surge in the platform’s trading volume.
Virtuals Protocol announced the TP cooldown history feature live as part of a new genesis update, providing more transparency and context to suppression points while offering reasons to help Virgens understand their cooldown status.
PancakeSwap recorded more than $100 billion in trading volume in May from low-tier liquidity pools with 0.01% fees, resulting in less CAKE token collection for burning. However, with the surge in spot value, the dollar value of burned tokens has increased while the count of CAKE tokens remains flat. Overall, the increased trading volume in low-fee liquidity pools reflects a growth in the ecosystem.
Injective centers as a real-world asset tokenization project, bringing multiple global assets and equities, such as the Magnificent Seven, on-chain. According to recent on-chain data, the 2025 trading volume has crossed $10 billion, with an average daily trading volume of $68 million. Meanwhile, iAssets (global market assets) trading volume hits $466 million as the network crosses 2 billion all-time transactions.
VIRTUAL holds bullish momentum
Virtuals Protocol trades by over 18% rise at $2.46 at press time on Wednesday with the TP cooldown feature release. With a 14% jump on Tuesday, VIRTUAL prints a bullish engulfing candle on the daily chart, catalyzing a positive crossover in the Moving Average Convergence/Divergence (MACD) indicator and its signal line, suggesting rising bullish momentum.
The price action showcases a 90% drop between January 1's closing price of $4.62 and April 8's closing price of $0.4181, with Fibonacci retracement highlighting the 50% level at $2.51.
As VIRTUAL hits the 50% line, investors with a buying price under the halfway point could book profits upon breakout. The 61.8% level at $3.01 and the 78.6% level at $3.72 are possible exit points, making these crucial resistance levels.
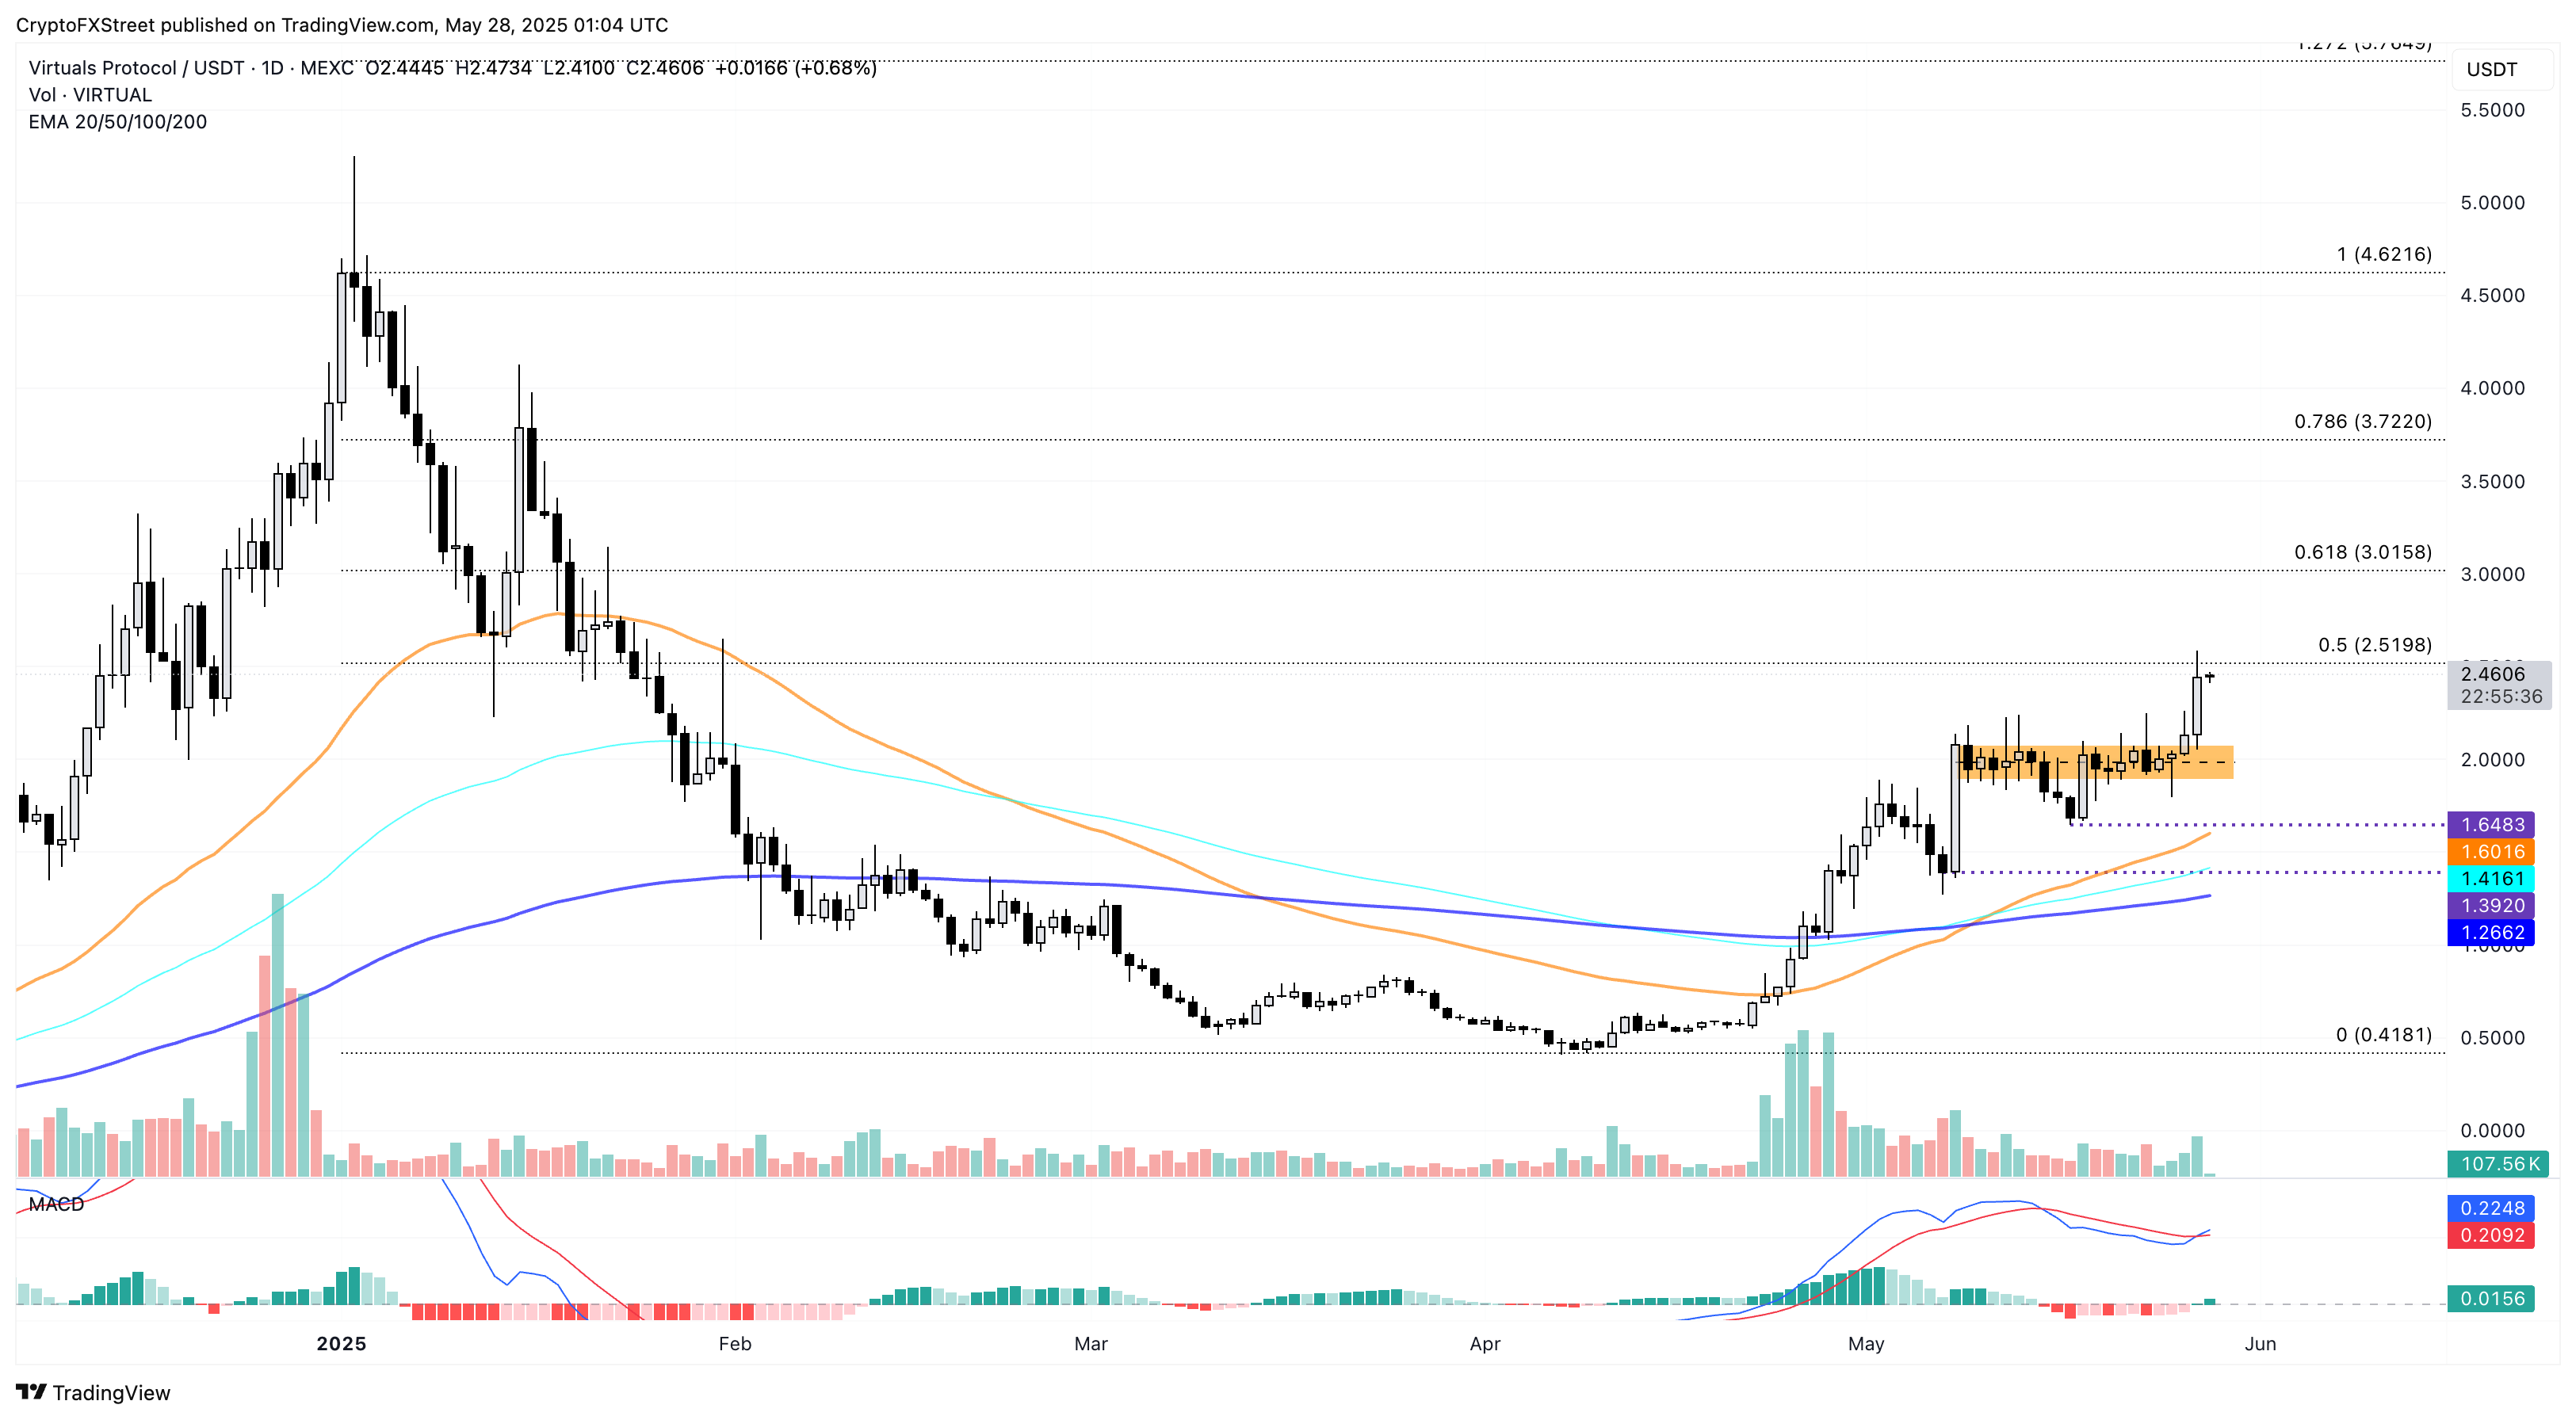
VIRTUAL/USDT daily price chart. Source: Tradingview
On the flip side, a reversal from the 50% level at $2.51 could retest the upper ceiling of the broken range at $2.08.
PancakeSwap eyes $2.77 breakout
PancakeSwap records a 16% surge to trade at $2.83 at press time on Wednesday, challenging a crucial supply zone between $2.74 and $2.84. The overnight surge pumps the weekly gains to 20% and nears a potential breakout.
The 50- and 200-day Exponential Moving Averages (EMAs) register a golden cross, signaling a trend reversal in CAKE. Cementing the trend reversal thesis, the MACD and signal line give a positive crossover, signaling a boost in buying pressure.
Similar to VIRTUAL, the Fibonacci retracement levels from $4.18 on December 8 to $1.354 on February 7 in CAKE highlight a 50% level at $2.77. With a decisive close above this level, the altcoin could test the 78.6% Fibonacci retracement at $3.57, a previously recorded peak on December 12.
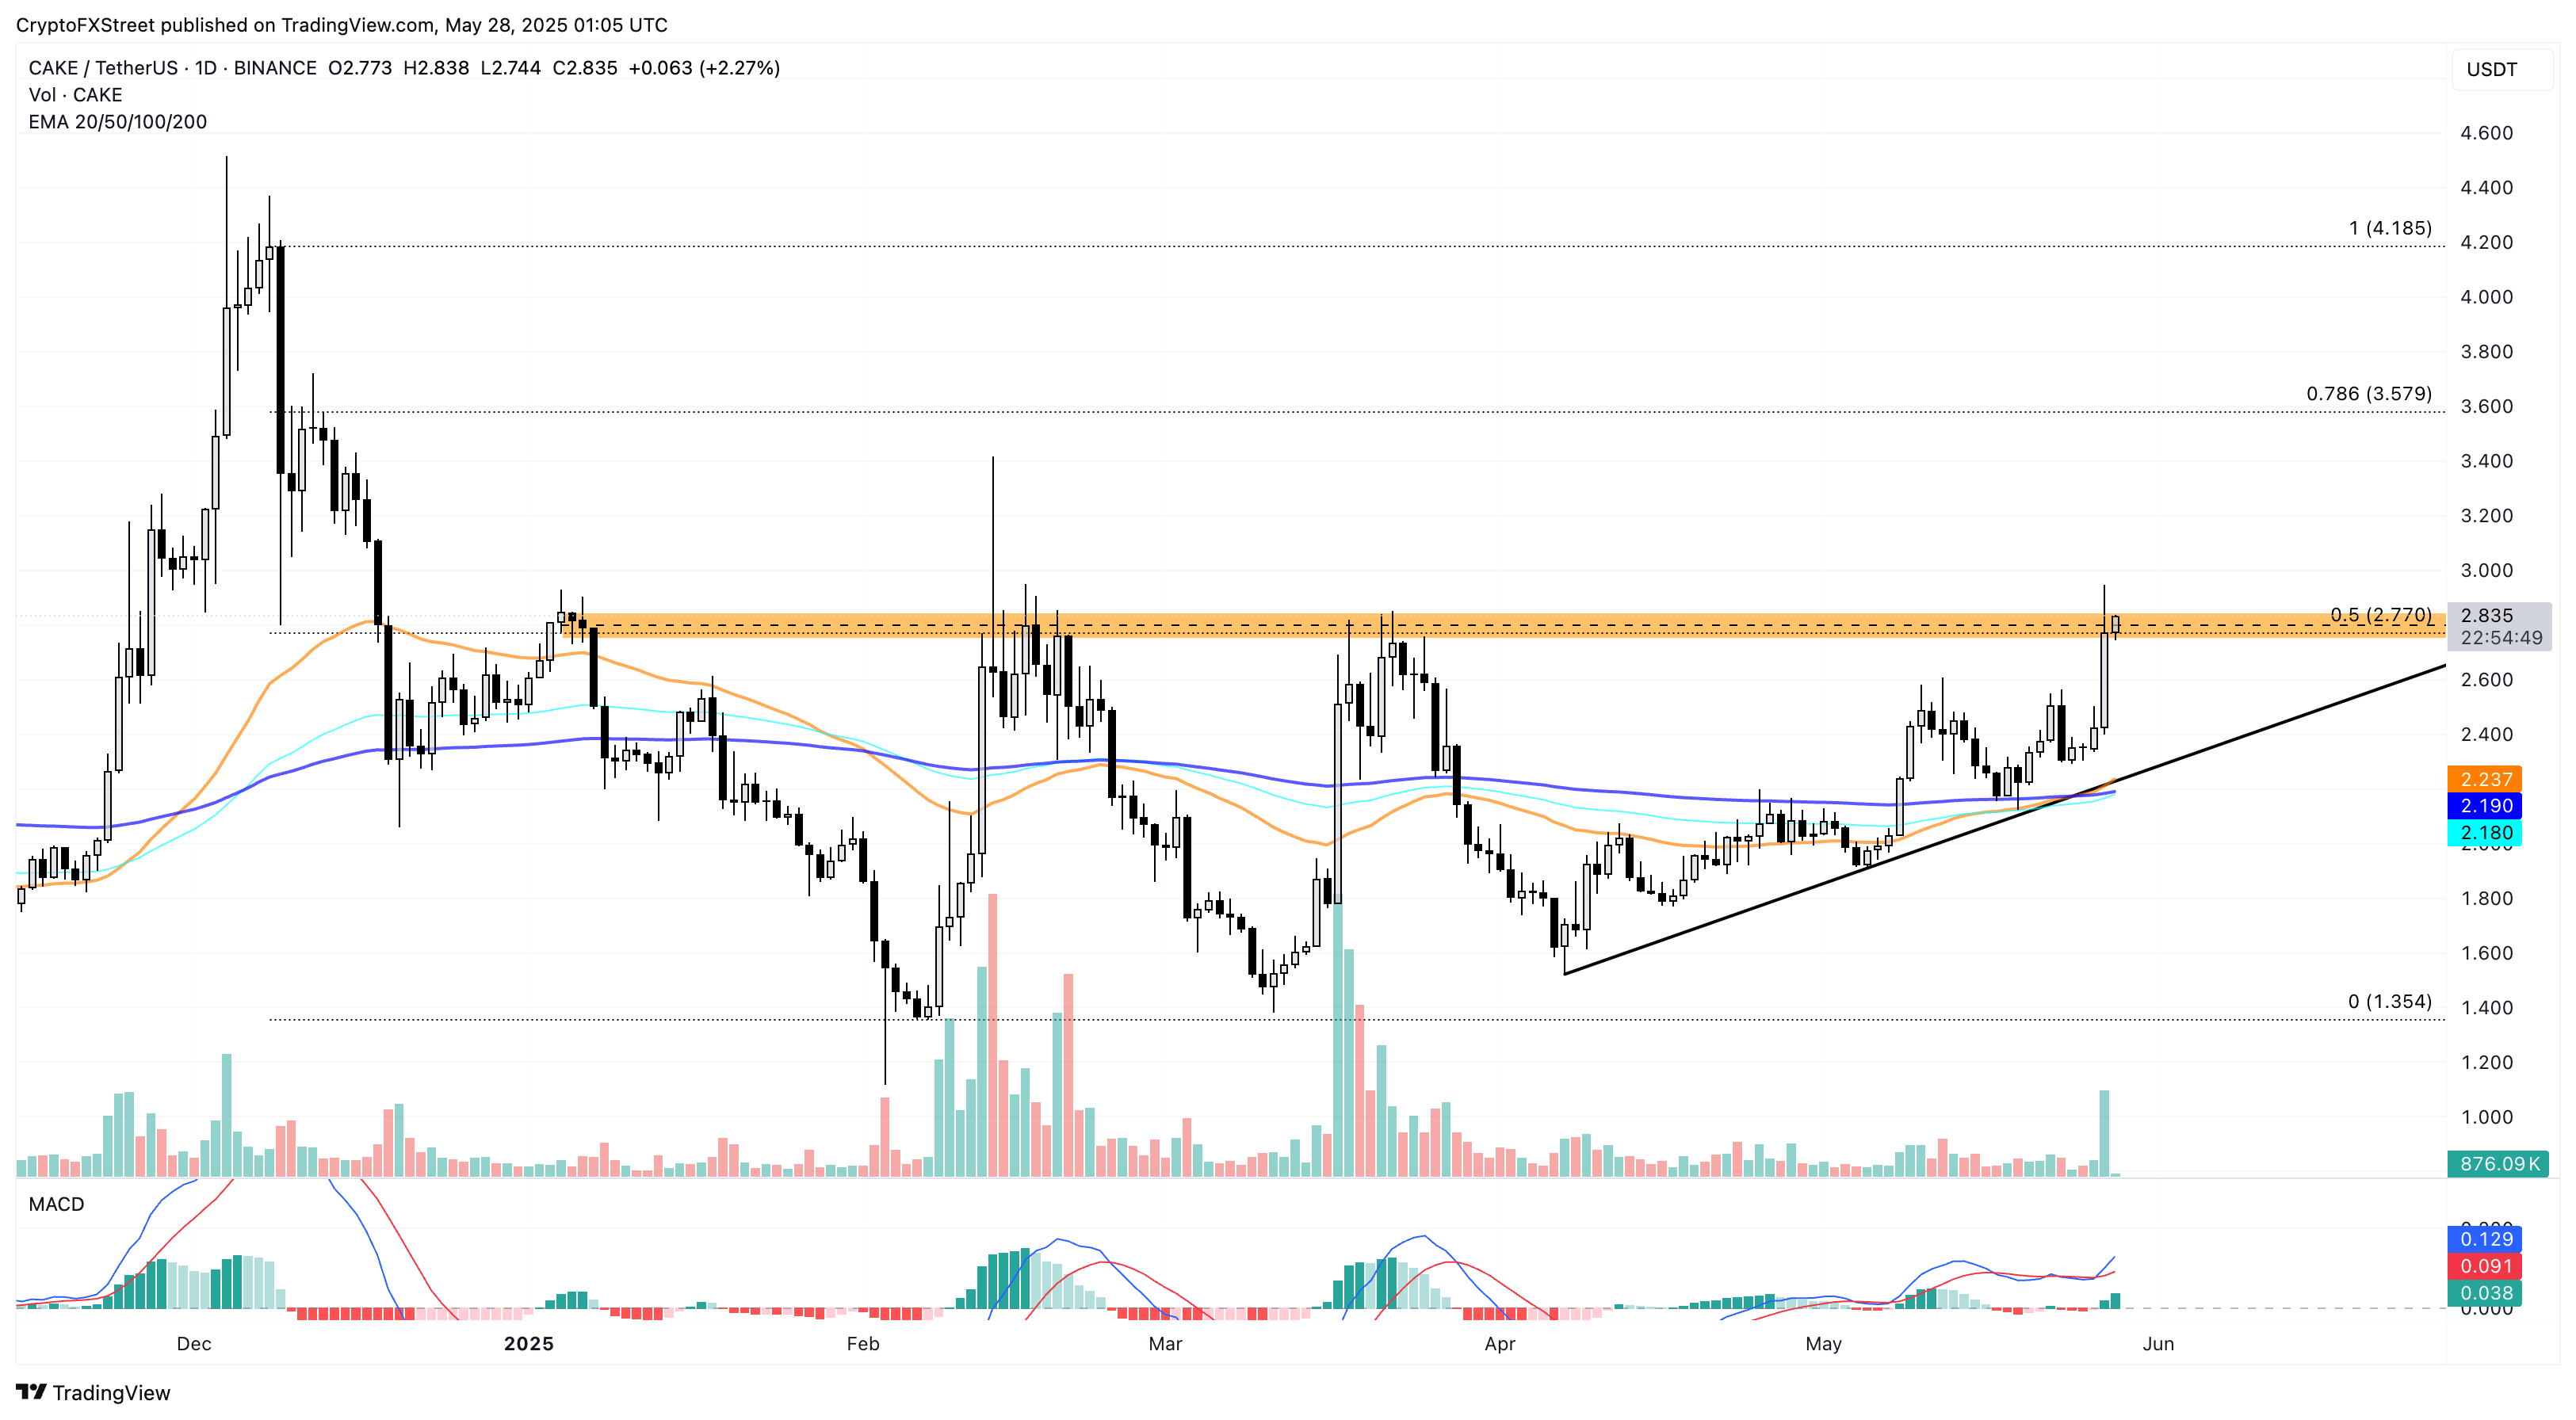
CAKE/USDT daily price chart. Source: Tradingview
On the flip side, the $2.50 psychological support could cushion a bearish turnaround.
Injective targets $18 amid growing uptrend
Injective has surged nearly 13% in the last 24 hours, trading at $15.13 at the time of writing. The uptrend surpasses the 200-day EMA at $14.84, marked by the third consecutive bullish candle on the daily chart.
With the impressive rally, the 50- and 100-day EMAs tease a bullish crossover. Furthermore, the MACD and signal lines diverge to regain a positive alignment, accompanied by a fresh wave of green histograms, which projects a surge in momentum.
Based on the Fibonacci levels extending from December 6 closing price at $34.02 to April 9 opening price at $6.91, the recovery rally nears the 50% level breakout at $15.33
Similar to other top gainers, a breakout above the halfway point of the previous crash could propel INJ to $18.51 (61.8% level) or $24.19 (78.6% level).
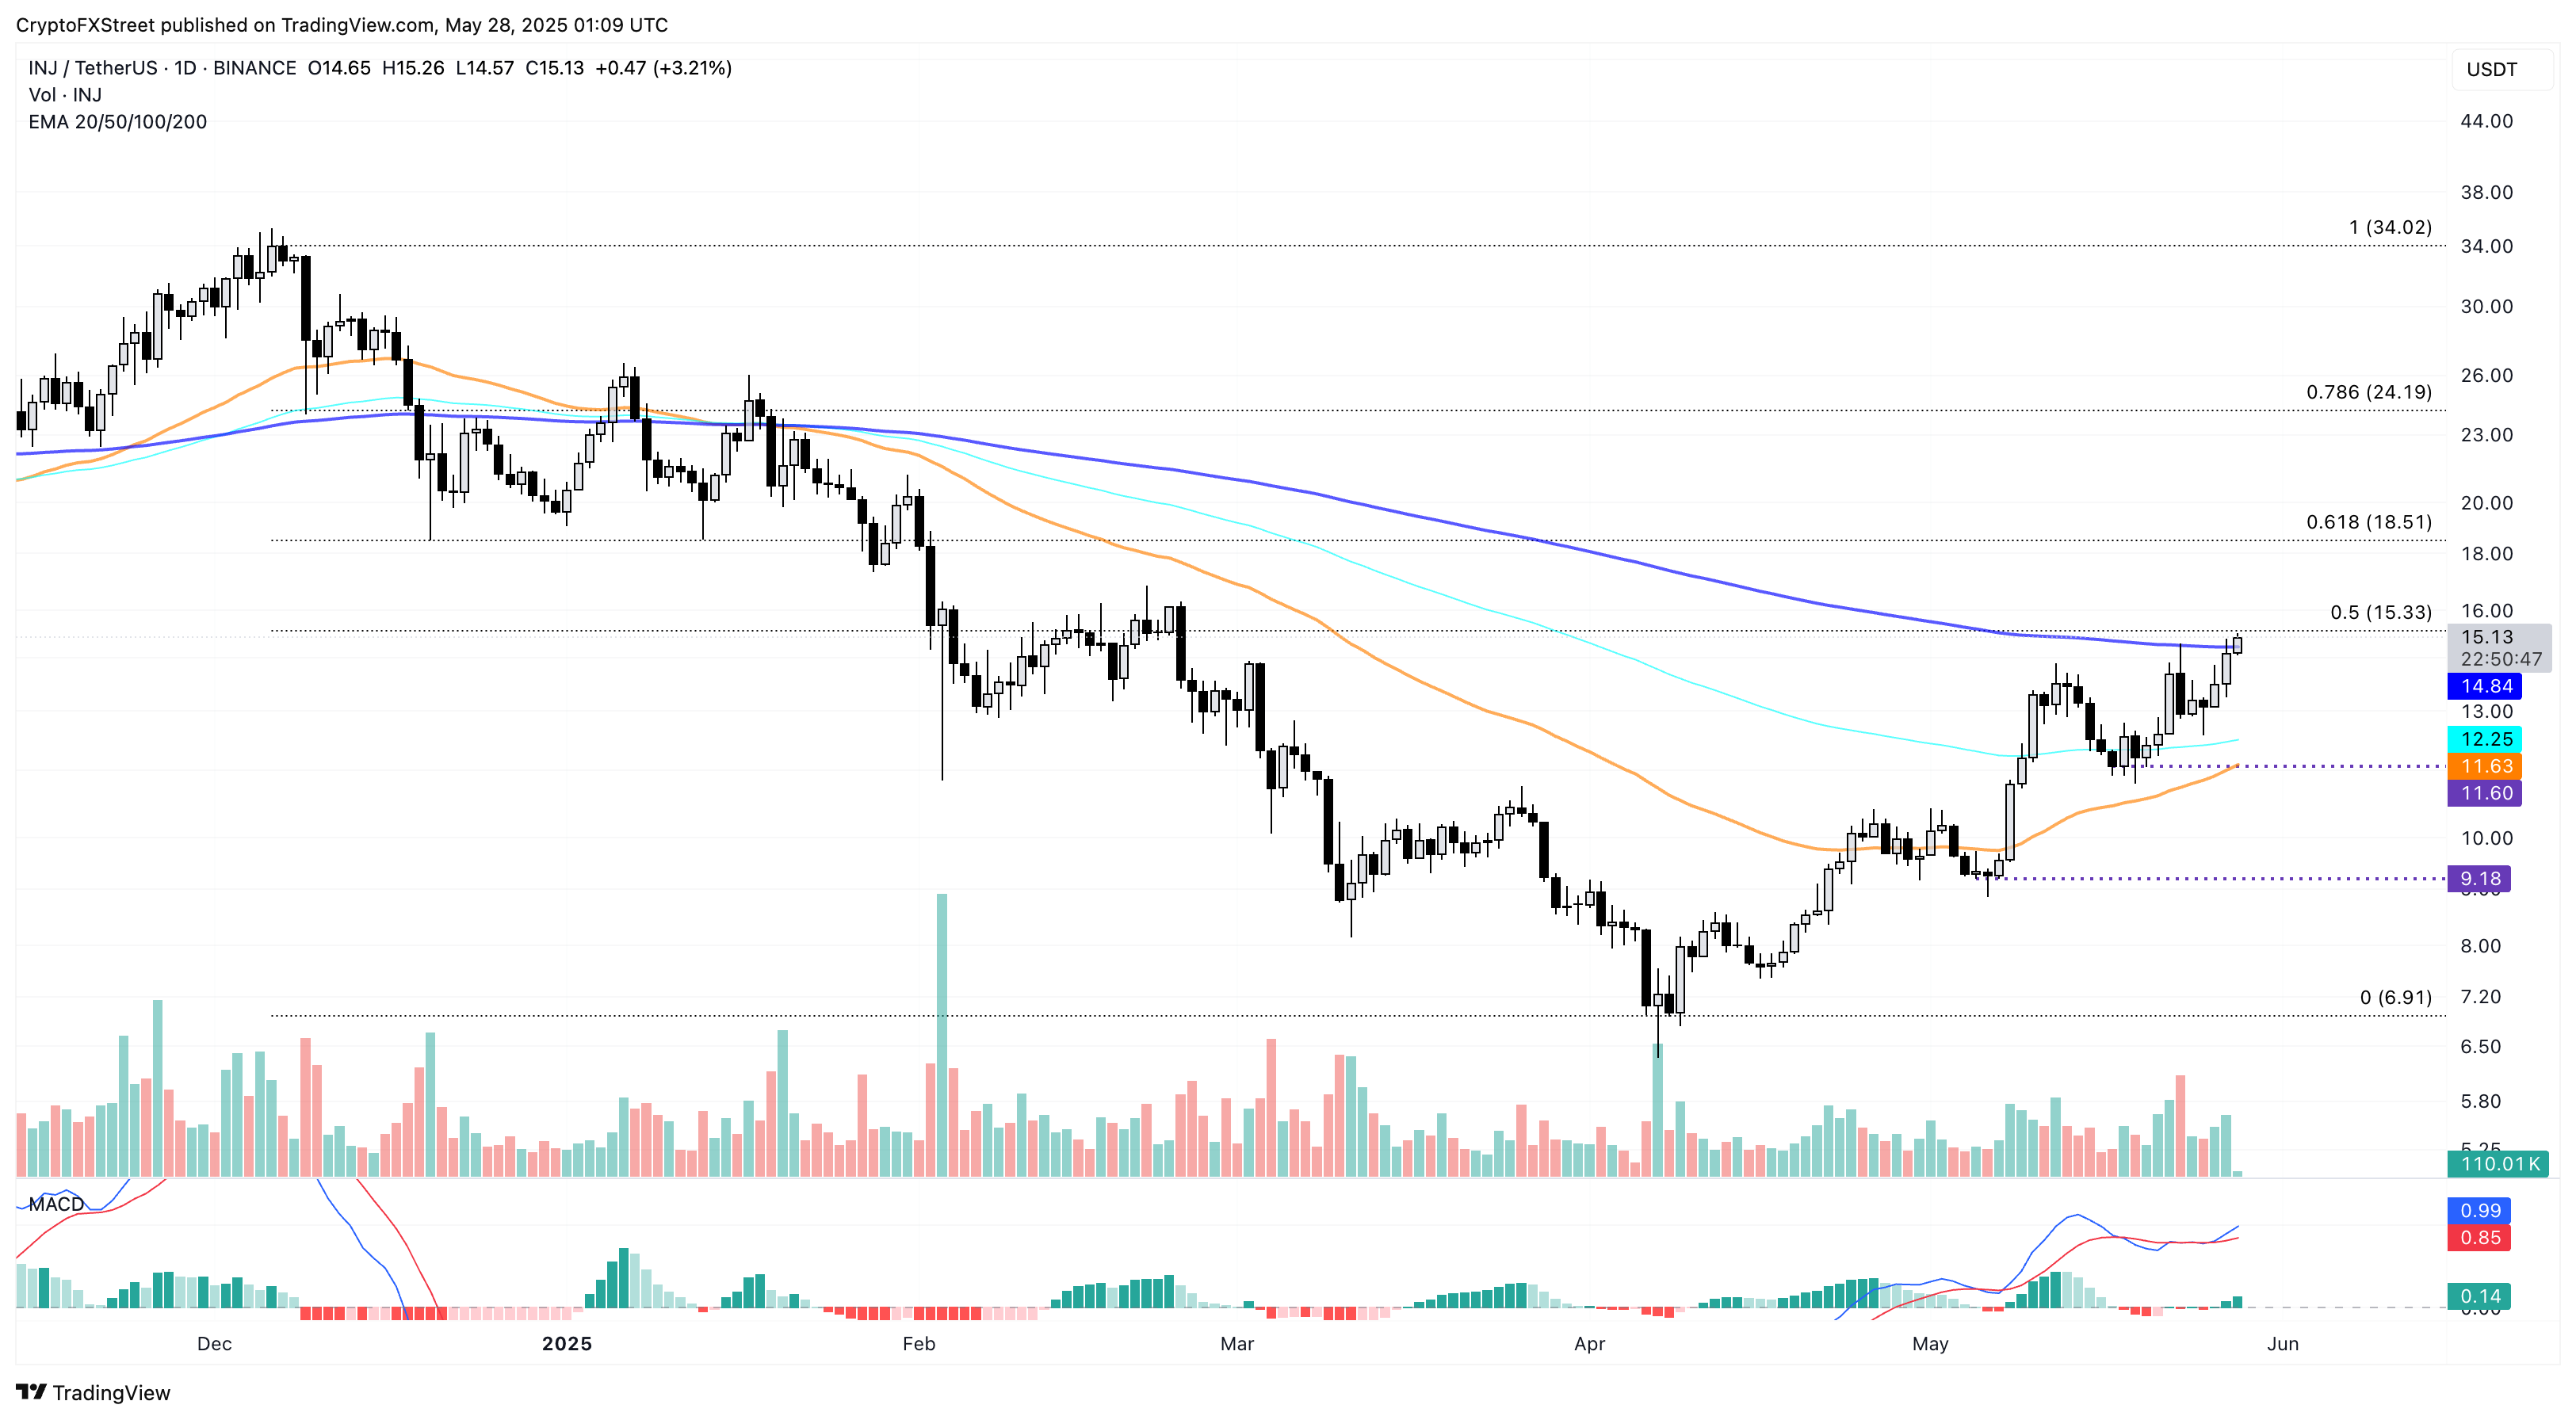
INJ/USDT daily price chart. Source: Tradingview
On the flip side, the 100-day EMA at $12.25 provides dynamic support, followed by the 50-day EMA at $11.63.
Author

Vishal Dixit
FXStreet
Vishal Dixit holds a B.Sc. in Chemistry from Wilson College but found his true calling in the world of crypto.