Top Gainers QNT JUP FORM: DeFi tokens rally as top altcoins stall
- Quant exceeds $100 with the announcement of Overledger Fusion, the first-of-its-kind layer 2.5 network.
- Technically, the JUP outlook suggests extended gains with a key pattern breakout.
- Four, previously known as BinaryX, leads the gaming tokens rally amid a bullish outlook.

The broader cryptocurrency market witnessed a slowdown in the top altcoins like Ethereum (ETH), Ripple (XRP), Solana (SOL), and Dogecoin (DOGE), with a 1% to 3% drop in the last 24 hours. Ignoring this, Quant (QNT) maintains a recovery trend, with the layer 2.5 network announcement for institutions and decentralized finance (DeFi). Jupiter (JUP) and Four (FORM) prolong the uptrend with technical signals suggesting breakout gains.
QNT targets 40% gains with pattern breakout
Quant records a sharp rise of 10% on Monday, surpassing the $100 psychological level. On Tuesday, the QNT token holds $104 with no significant movement at press time.
With a bullish engulfing candle formed on Monday, the price action registers an inverted head-and-shoulders pattern breakout, as shared in the daily price chart below. This marks a potential beginning of a trend reversal rally in Quant.
Supporting the reversal thesis, the 50- and 200-day Exponential Moving Averages (EMAs) record a golden cross. Additionally, the Moving Average Convergence/Divergence (MACD) and its signal line record a positive crossover on Tuesday, suggesting a bullish trend ahead.
The 41% pattern breakout target is estimated by extrapolating the depth of the pattern to the neckline at $101, suggesting an uptrend to $143. Based on the Fibonacci retracement, from $165 on December 7 to $59.90 on April 8, the 78.6% level coincides with the $143 price target. However, minor hurdles are present at the $112 (50% level) and $125 (61.8% level).
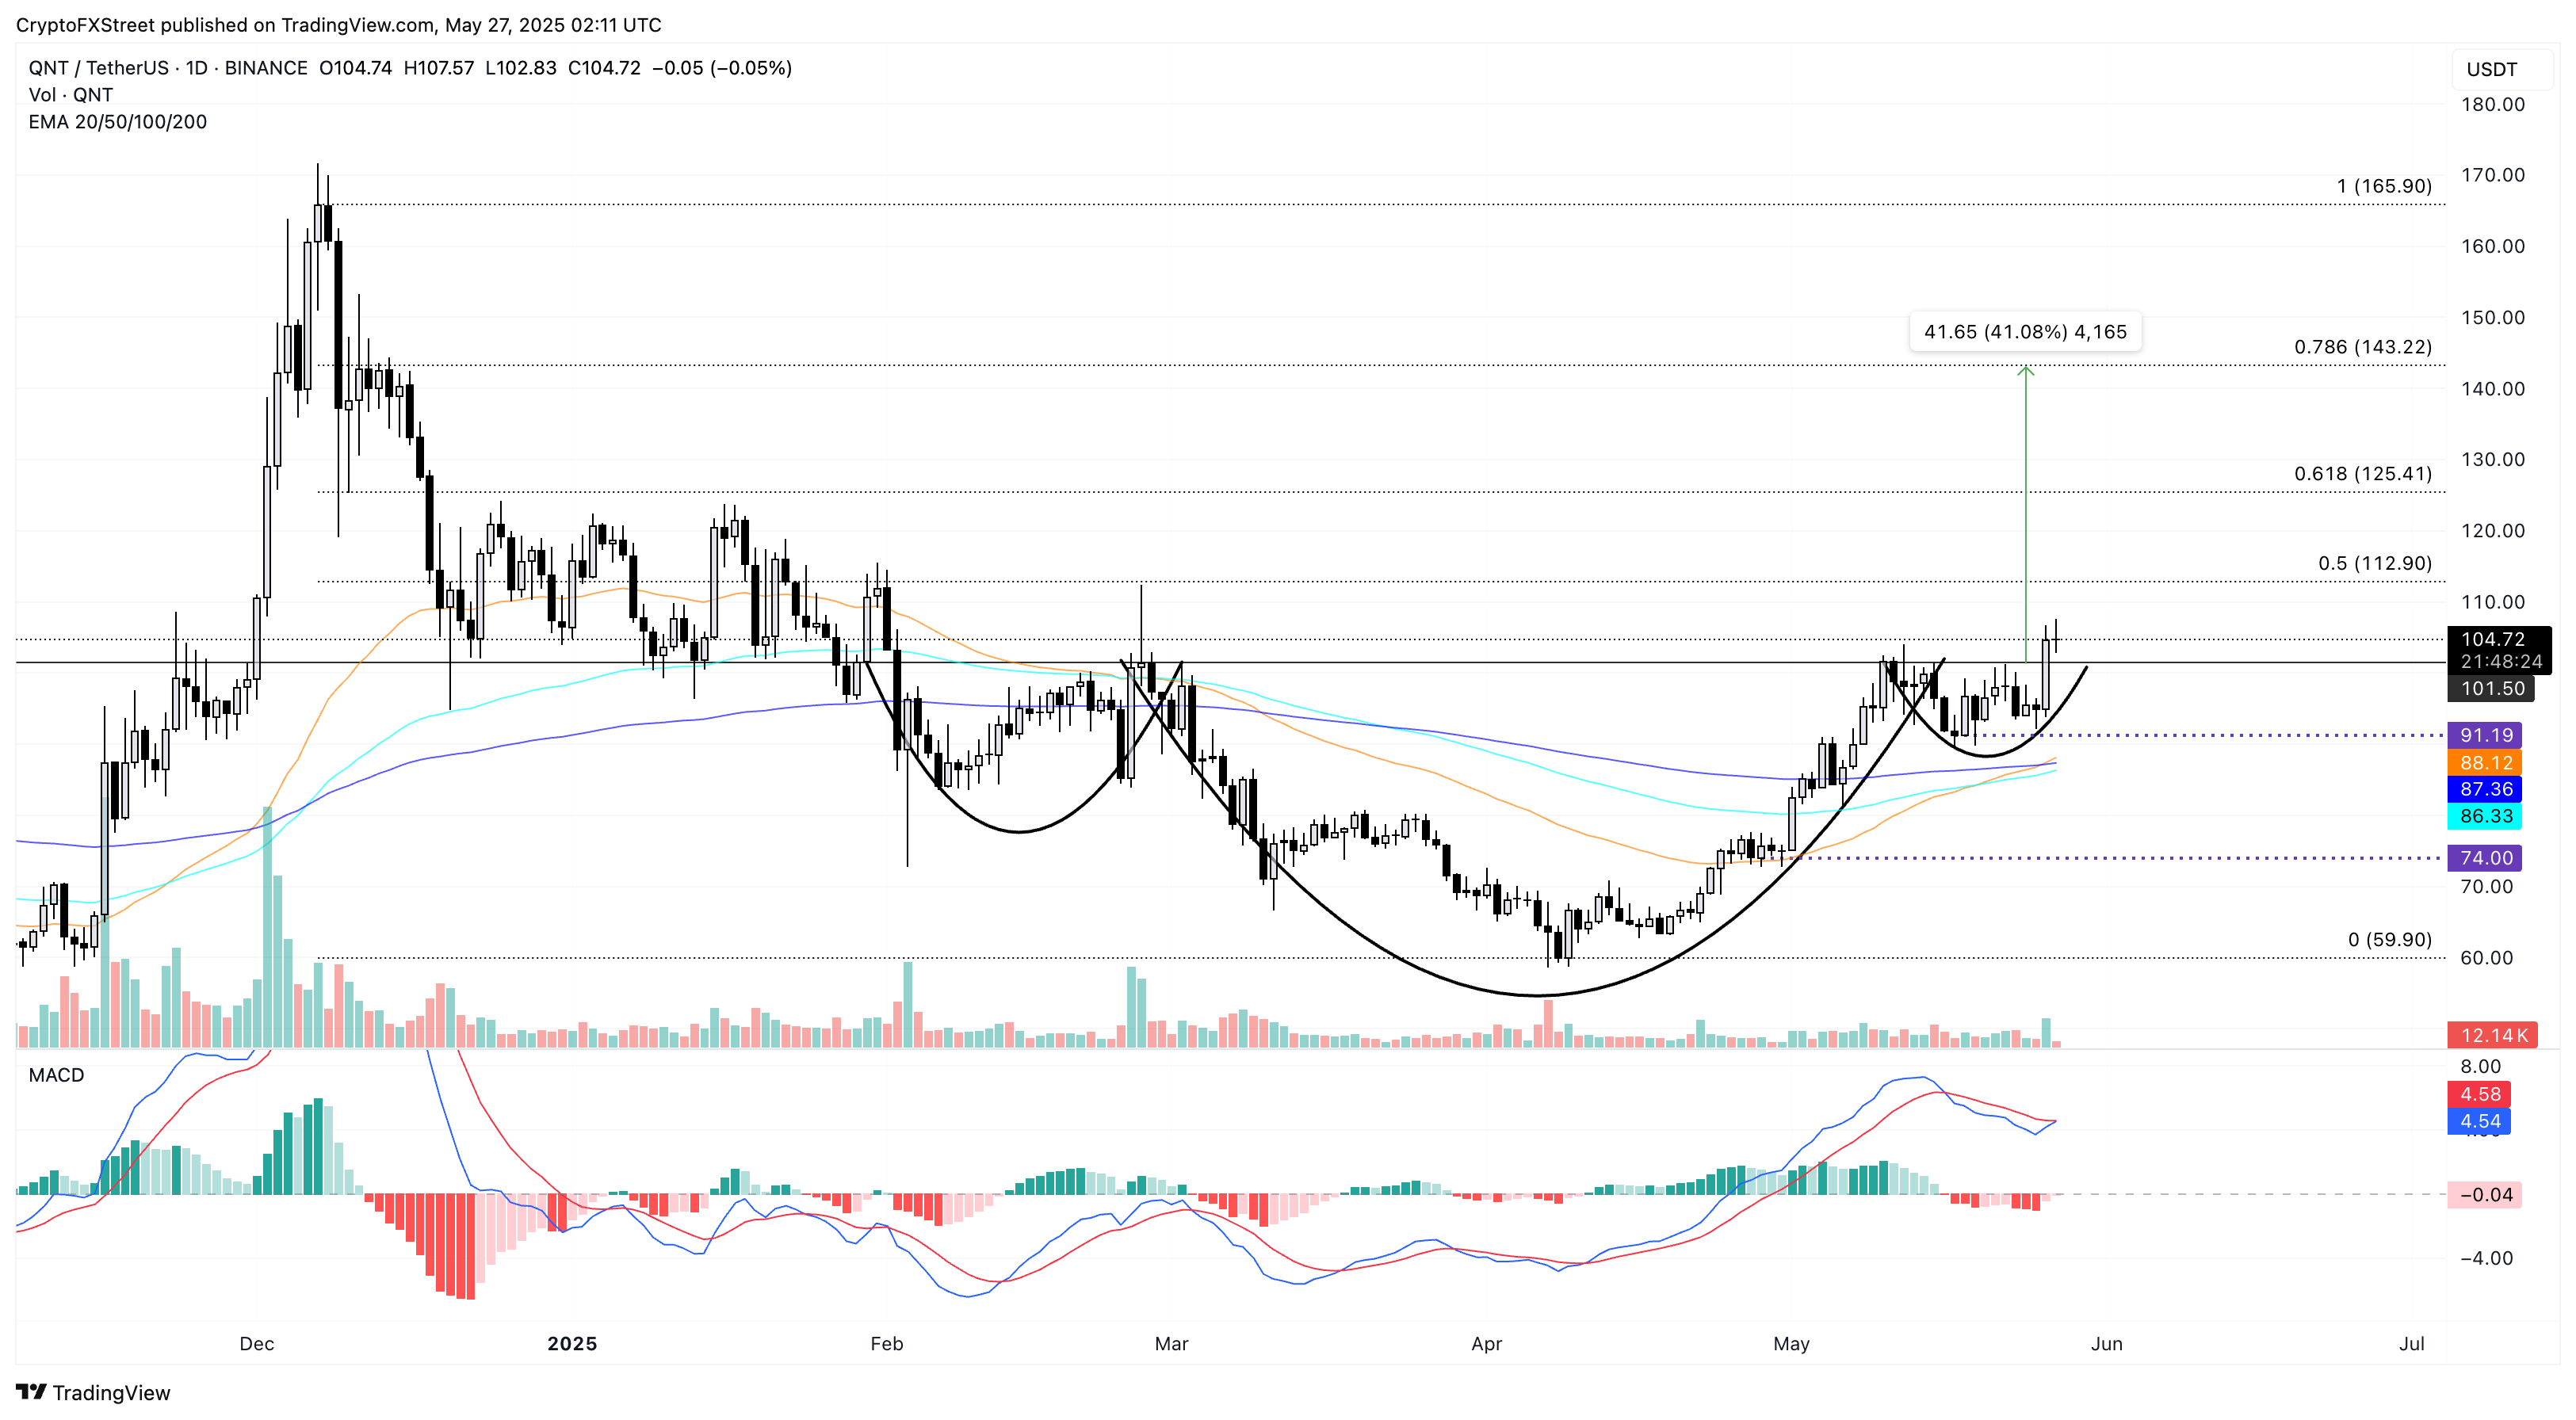
QNT/USDT daily price chart. Source: Tradingview
Conversely, a drop under the $100 level could invalidate the bullish pattern, extending the correction to the $91 support level.
Jupiter sustains uptrend, records rounding bottom breakout
Jupiter trades at $0.5932 with over 5% gains over the last 24 hours at press time on Tuesday. The rising JUP token records over 26% gains this month to reclaim the $0.50 psychological level.
With a 9% jump on Monday, JUP token exceeds $0.5839, acting as the neckline of a rounding bottom pattern shared in the daily price chart below. The extended rally holds above the 100-day EMA (light blue) at $0.5581, aiming to challenge the 200-day EMA (deep blue) at $0.6662.
The MACD indicator sustains a positive trend with its signal line after multiple fake crossovers due to a choppy uptrend in JUP spot prices. Hence, investors must remain cautious as Jupiter nears the 200-day EMA, which could lead to volatile price movements.
With the pattern breakout, the 45% price target at $0.8480 is calculated similarly to Quant’s, close to the March 2 peak at $0.8357.
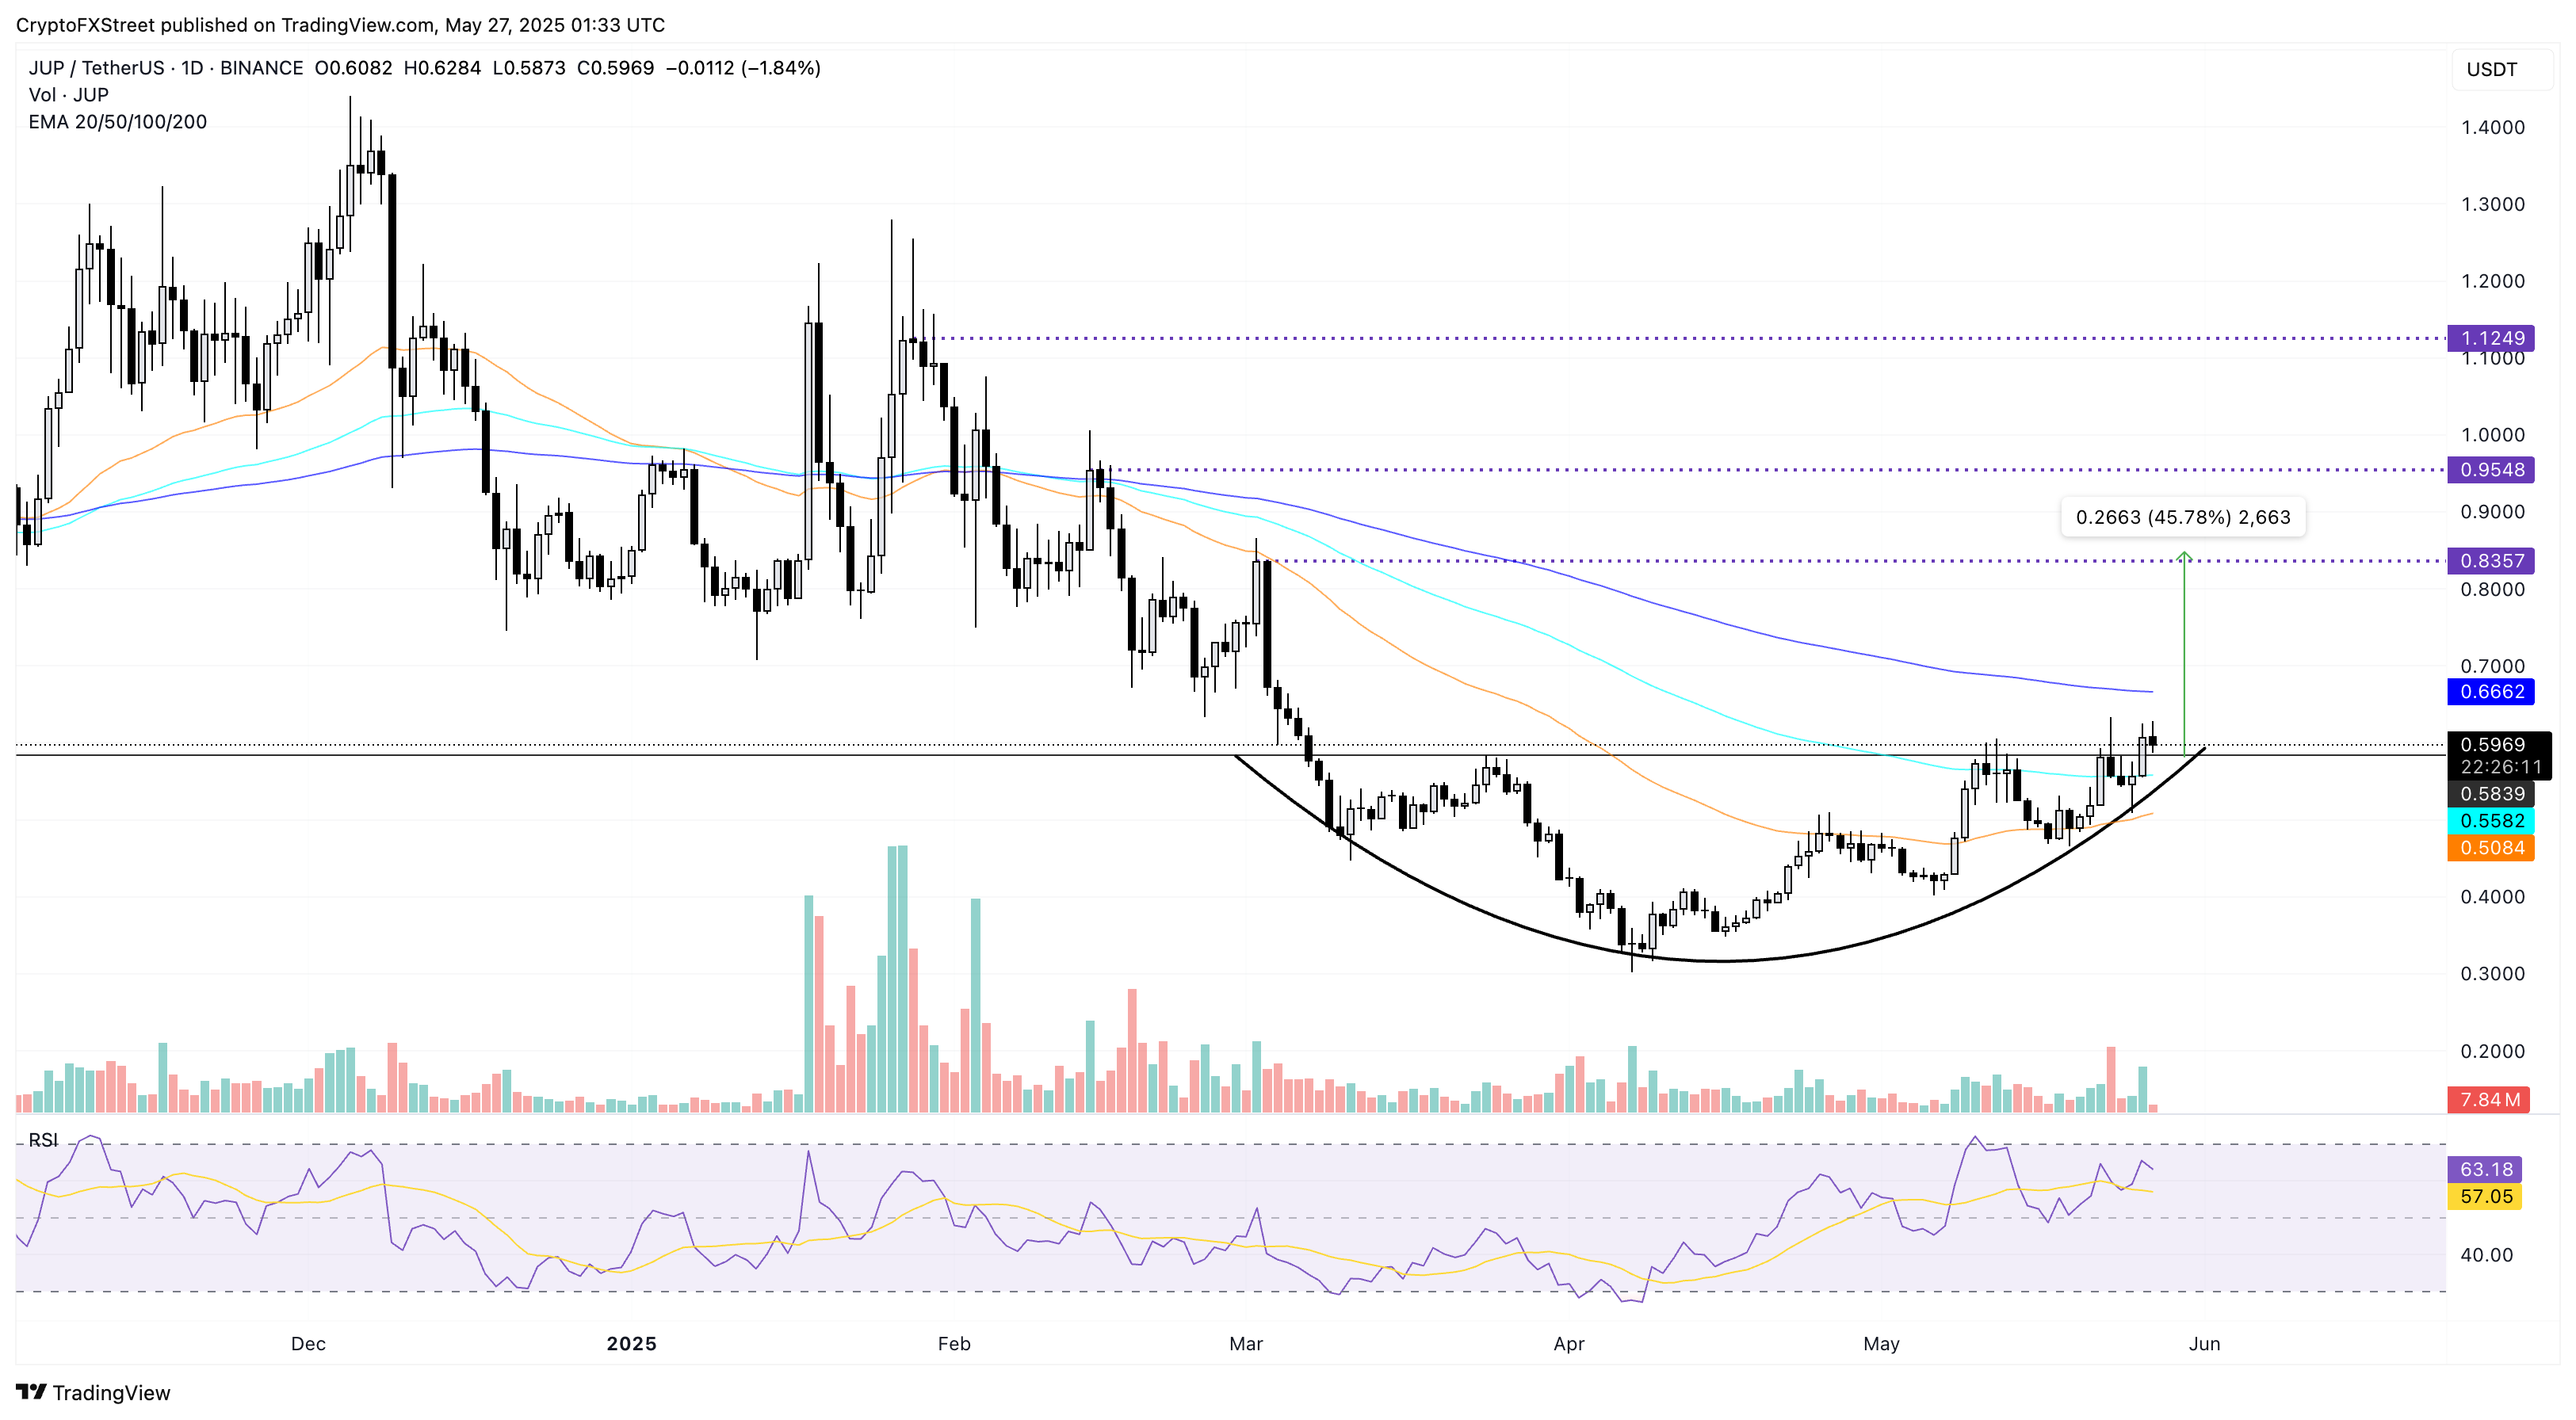
JUP/USDT daily price chart. Source: Tradingview
However, a closing under the $0.5839 neckline will nullify the bullish pattern, potentially leading to the 50-day EMA (yellow) retest at $0.5084.
FORM uptrend targets rising wedge breakout
BinaryX rebranded as Four (FORM) gains momentum with the new persona, scaling more than 40% this month, trading at $3.00 at press time. With a 4.80% surge on Monday, Four hit a new all-time high as it tests uncharted levels.
In the daily chart, the price action forms a rising wedge pattern with long-wick candles from March 24 to May 26, giving rise to a resistance trendline alongside the converging supporting trendline starting from March 20, with a touchdown during early May consolidation.
Technical indicators maintain an upbeat outlook as FOUR trades near the wedge’s upper boundary. The MACD and its signal line give a positive crossover after a short fake crossover event, reflecting the resurgence of buying pressure.
The Relative Strength Index (RSI) at 70 hits a crucial level as it moves flat near the overbought boundary line. As RSI reaches a crossroads, the recent recovery supports the bullish momentum but brings the risk of overbought conditions.
With the use of trend-based Fibonacci extension over the $0.80 low on March 14 to the $2.44 peak on March 24 and the third leg at $1.91 on April 6, a potential breakout rally could face resistance at $3.56, aligning with the 100% level.
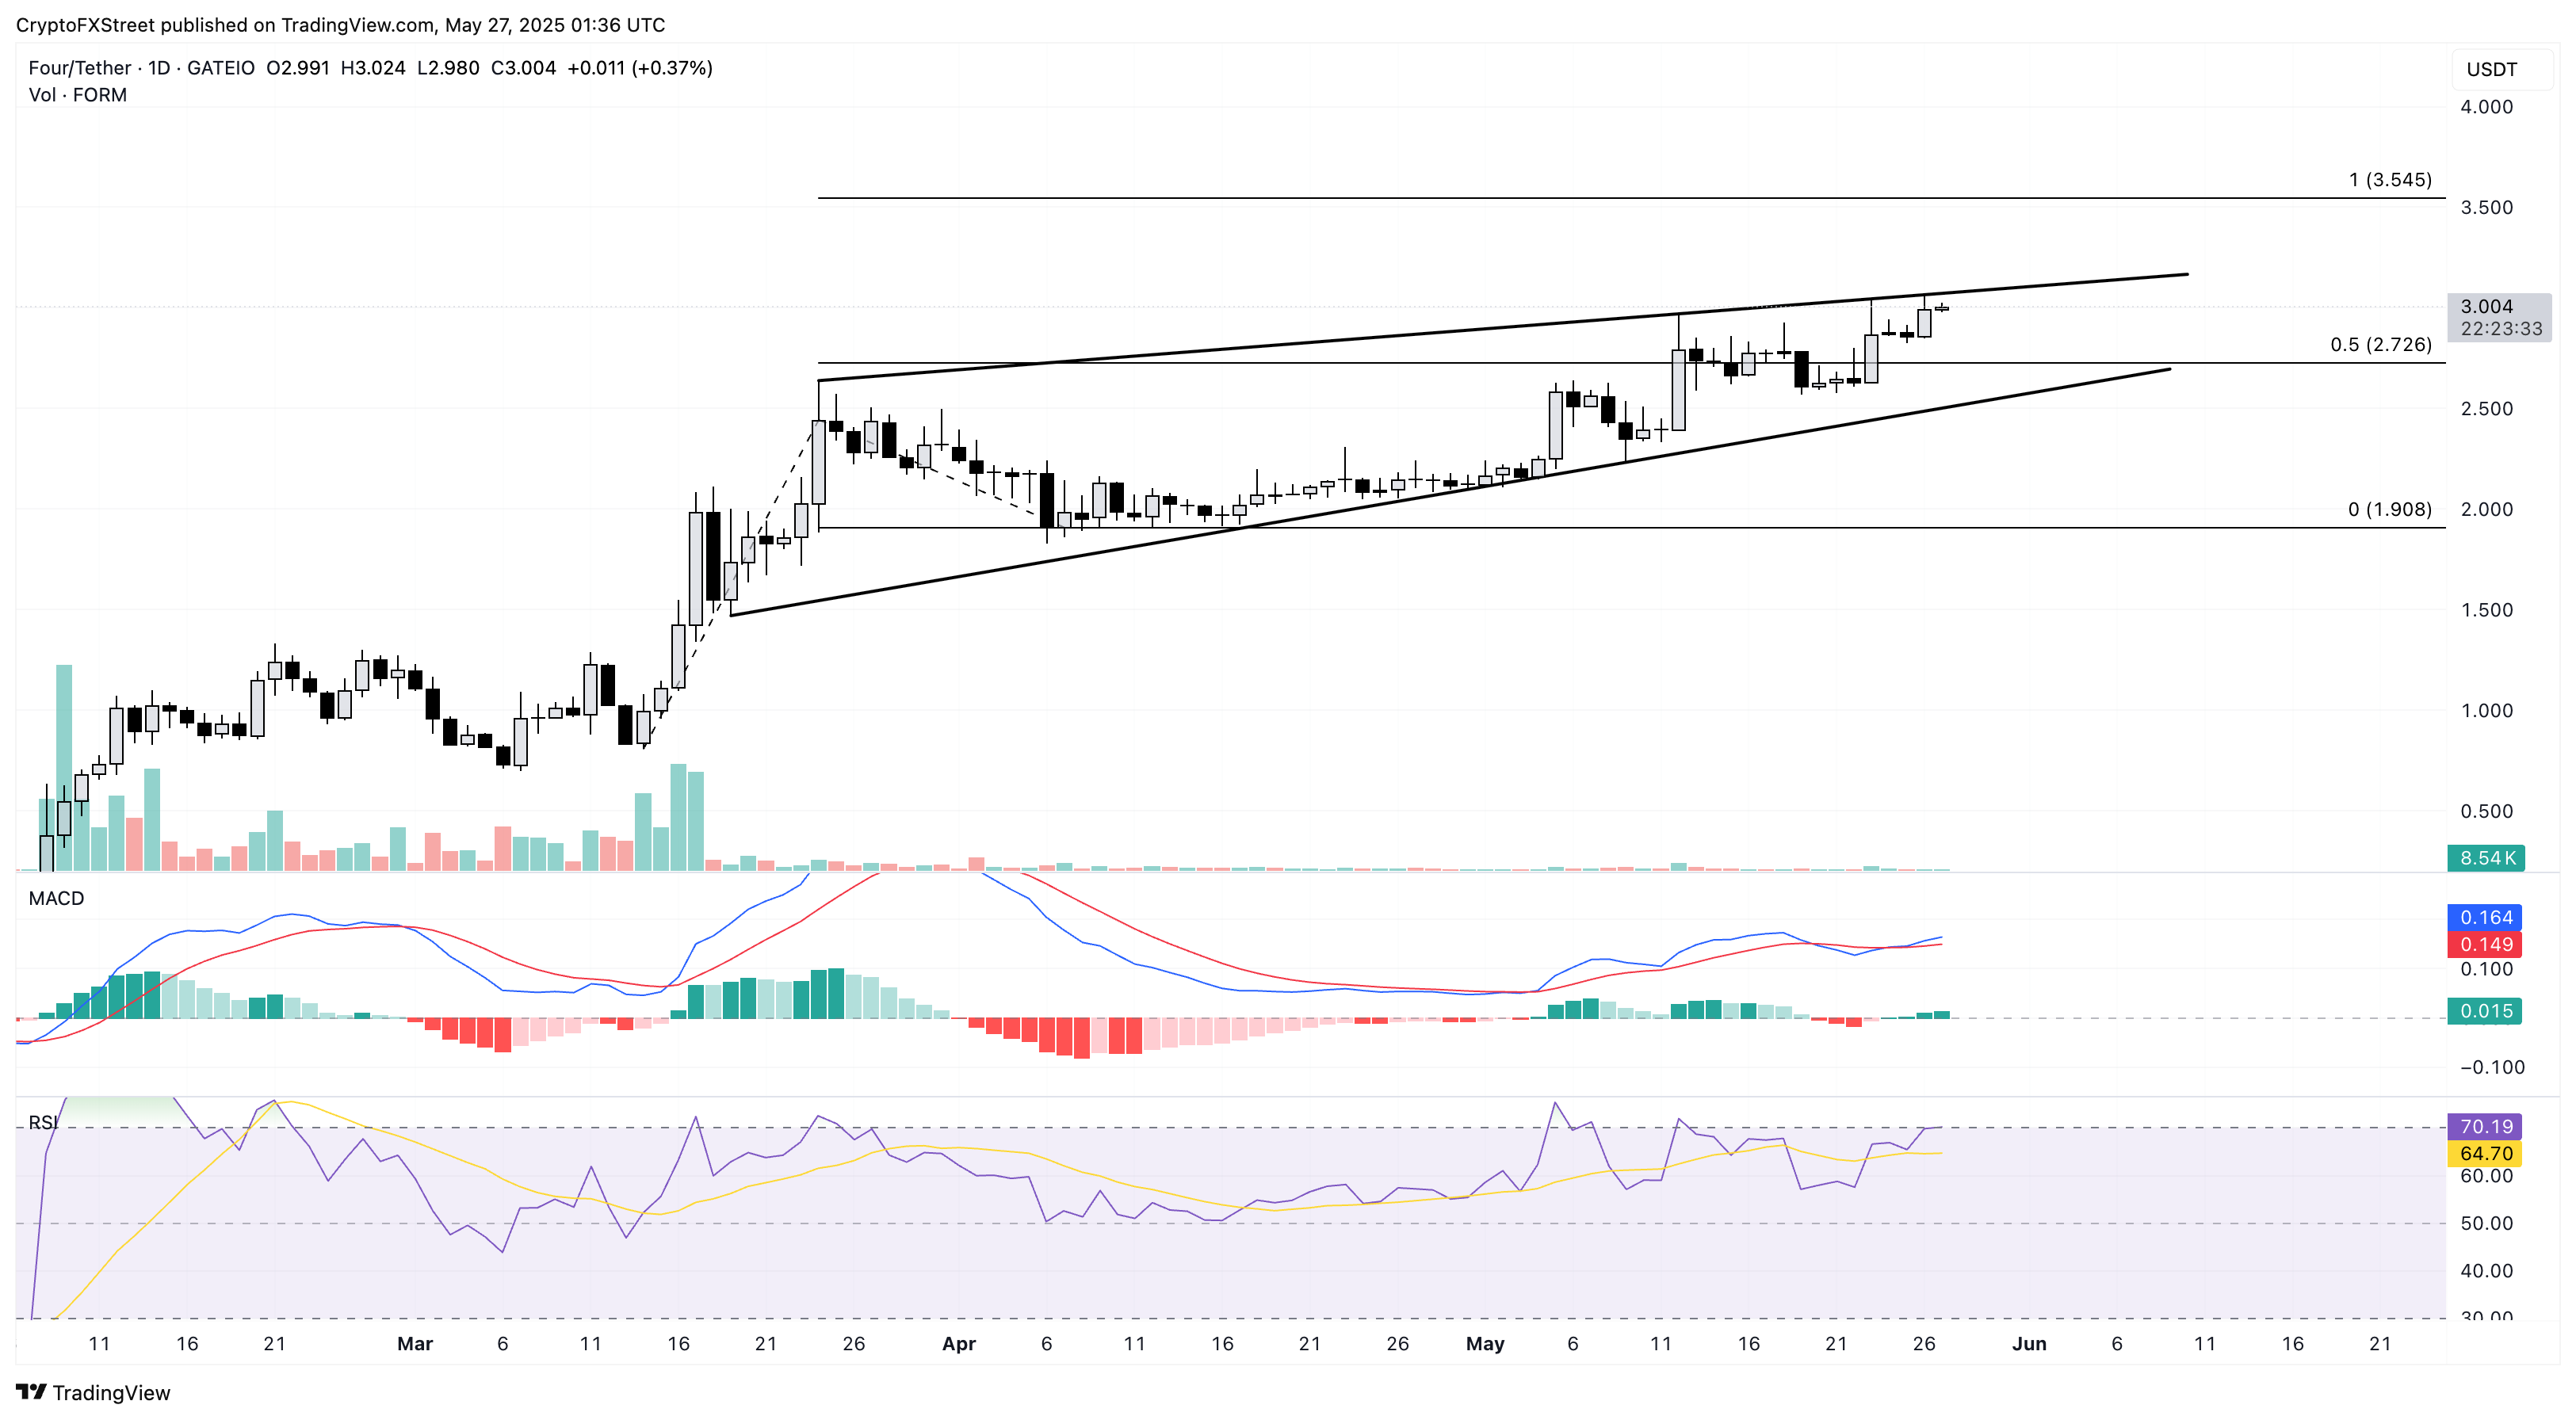
FOUR/USDT daily price chart. Source: Tradingview
Conversely, a flip from the overhead trendline could test $2.73, which aligns with the 50% level.
Author

Vishal Dixit
FXStreet
Vishal Dixit holds a B.Sc. in Chemistry from Wilson College but found his true calling in the world of crypto.


