Top Crypto Gainers Price Prediction: SEI, WIF, VIRTUAL post double-digit gains amid Israel-Iran ceasefire
- SEI edges higher to extend Monday gains, teasing a potential 200-day EMA breakout.
- WIF targets $1 as it registers double-digit gains, undermining the previous three-day crash.
- VIRTUALS bounces off 23% from the 200-day EMA, aiming to challenge the overhead trendline near $2.

The Israel-Iran ceasefire announcement fuels a sudden recovery in the broader cryptocurrency market, with Bitcoin (BTC) reclaiming $105,000. Altcoins such as Sei (SEI), Dogwifhat (WIF), and Virtuals Protocol (VIRTUALS) are leading the market by double-digit gains at press time on Tuesday. The top-gaining altcoins’ reversal rally extends gains, targeting higher levels as risk-on sentiment returns to the cryptocurrency market.
The US President Donald Trump announced the complete ceasefire conditions between Israel and Iran after their ongoing final missions. The ceasefire will be initially agreed by Iran, followed by a pause of 12 hours before Israel accepts the ceasefire, resulting in an official end to the 12-day war in the Middle East on the 24th Hour.

Donald Trump's ceasefire announcement. Source: Truth Social
SEI Price Forecast: Recovery rally targets two-month high
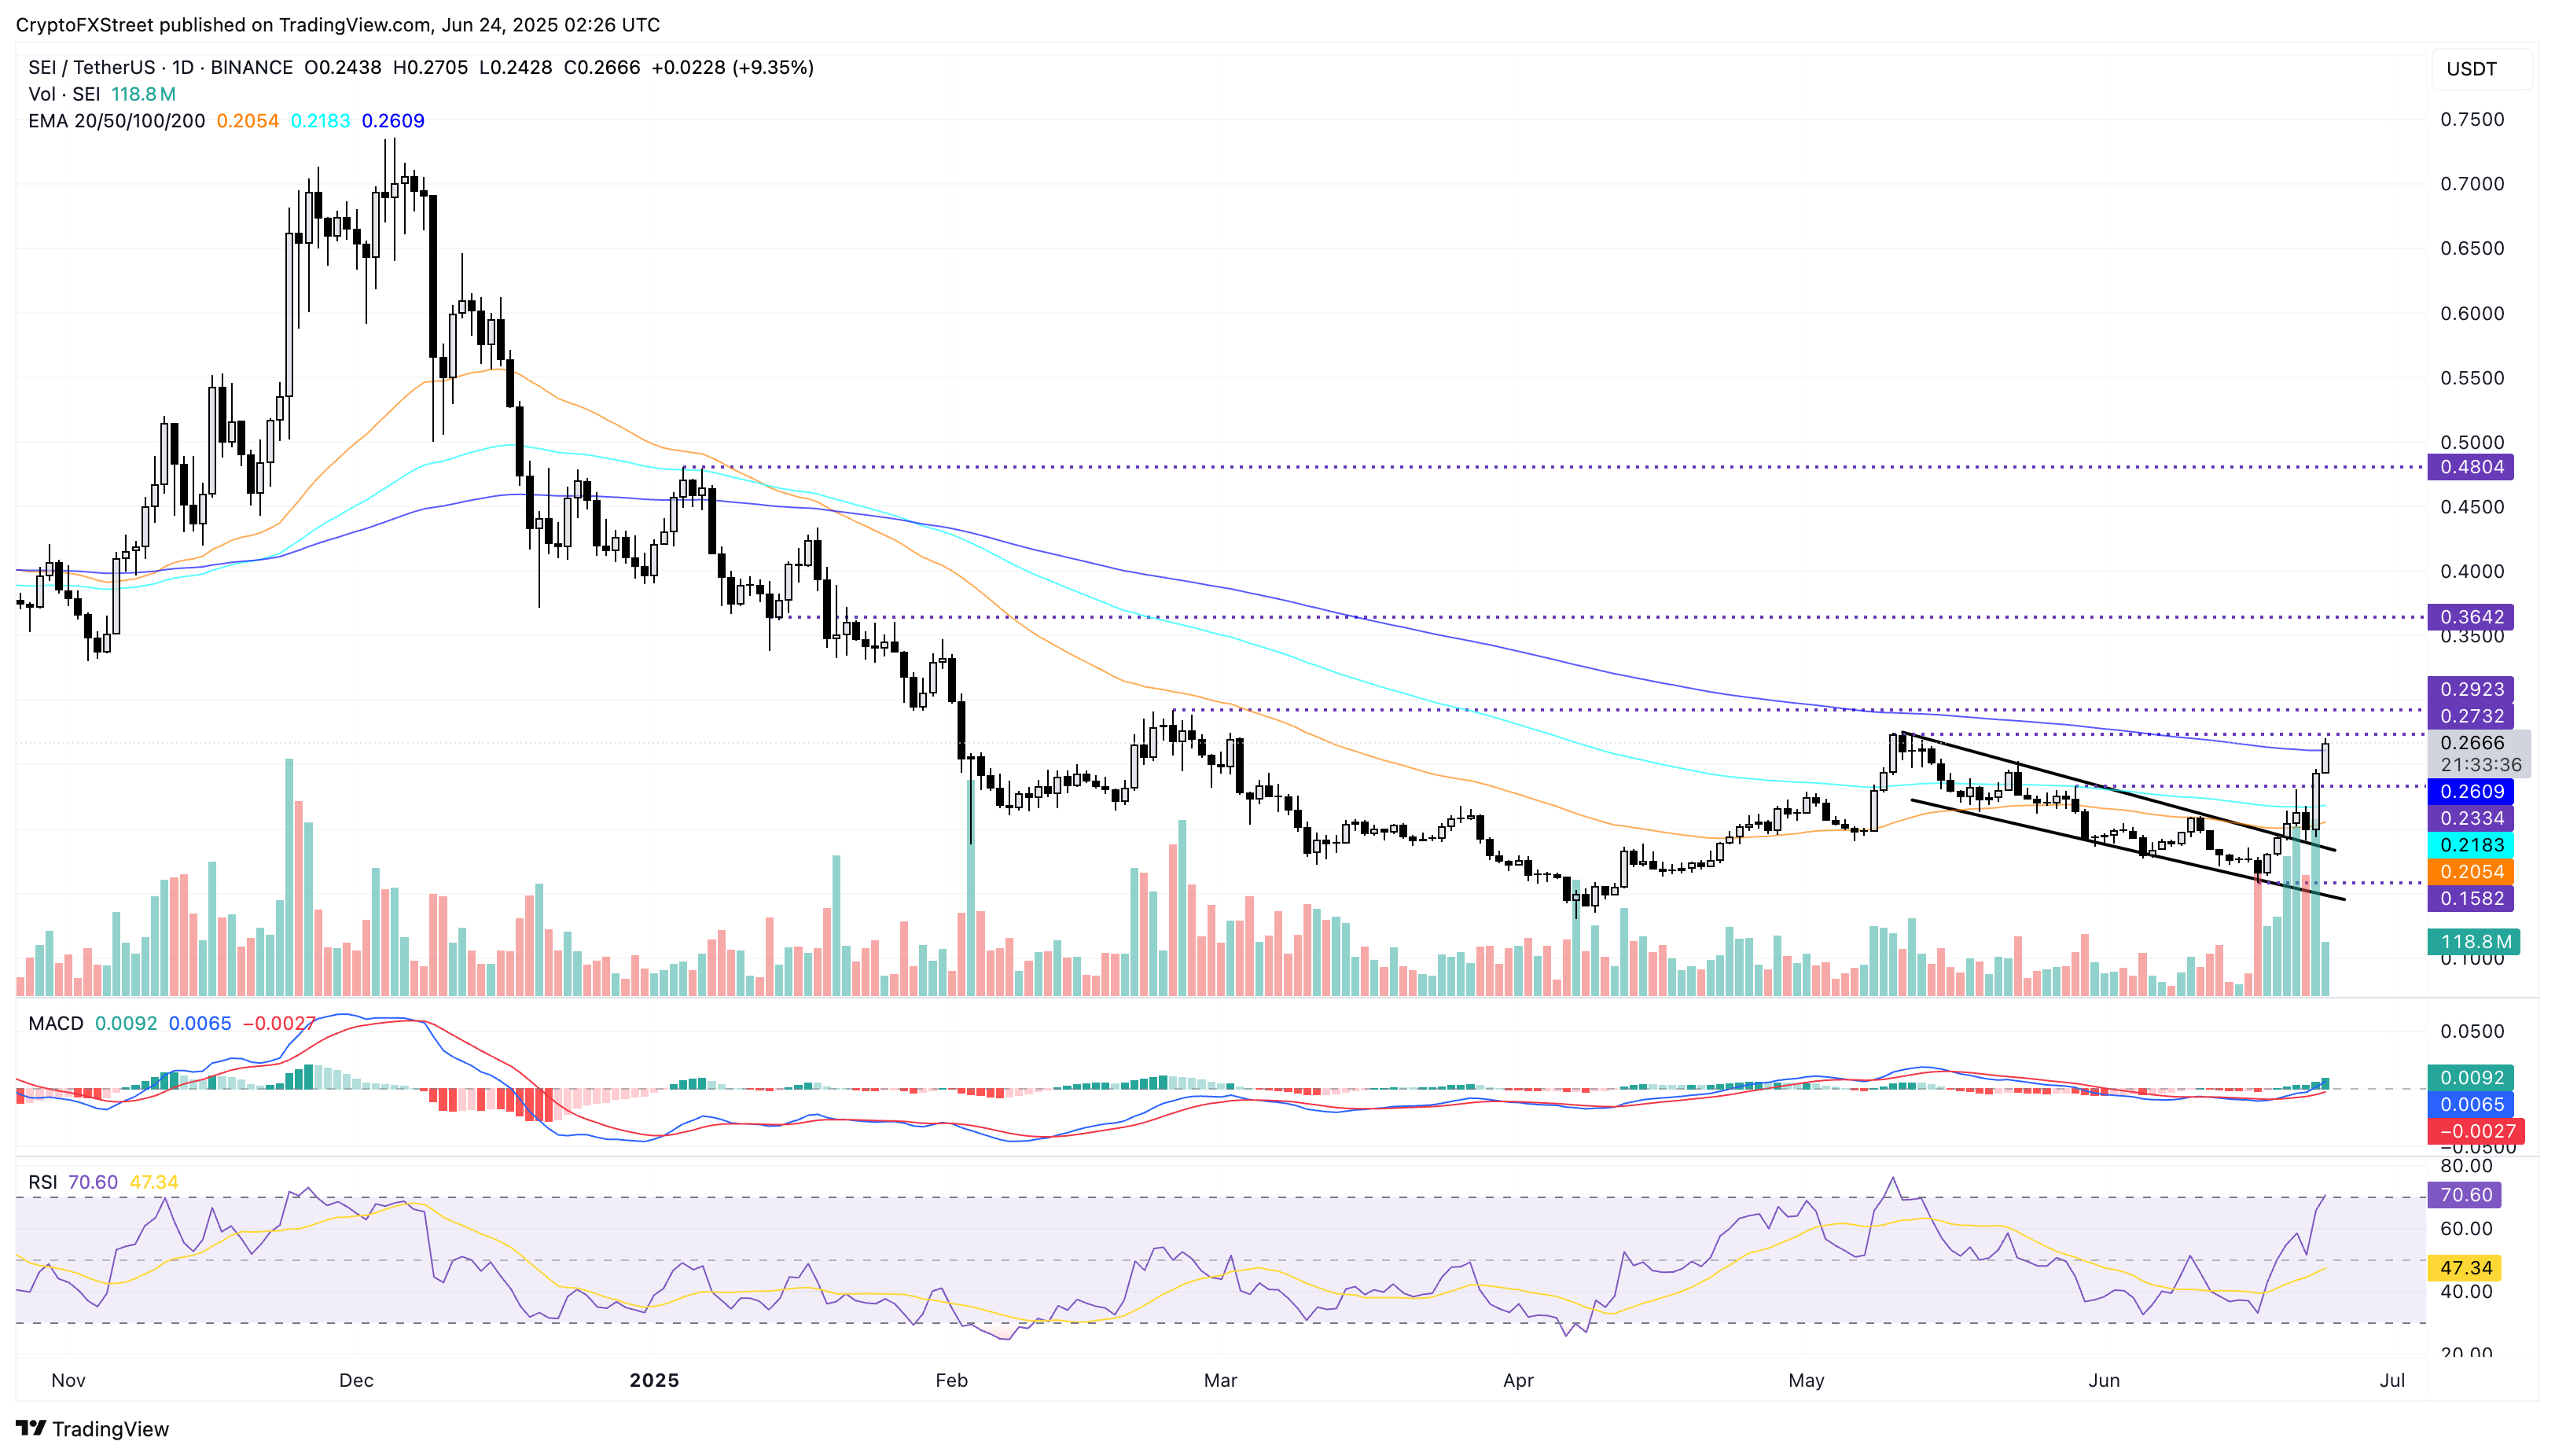
Sei edges higher by 9% at press time on Tuesday, extending its 22% gains from Monday. The recovery run exceeds the 200-day Exponential Moving Average (EMA) at $0.2609 with the second bullish candle in making.
Aiming towards $0.2732, May’s high, SEI recovery shows potential to reach a new 60-day high. Furthermore, the $0.2923 level marks the highest price since February, acting as the follow-up resistance.
A clean push above $0.2923 could extend Sei’s uptrend towards the $0.3642 level, last tested on January 21.
Turning to momentum indicators, a surge in bullish momentum is evident. The Moving Average Convergence/Divergence (MACD) indicator crosses above the zero line with its signal line, triggering a buy signal. A fresh wave of green histogram bars from the zero line suggests a new bullish trend in motion.
The Relative Strength Index (RSI) at 70 indicates a spike in buying pressure as it approaches the overbought zone. However, investors must exercise caution amid the increased risk of a pullback during overbought conditions.
WIF/USDT daily price chart.
If the altcoin fails to close above the 200-day EMA, a retest of the 100-day EMA at $0.2183 is possible.
WIF Price Forecast: Morning star pattern revives bullish hope
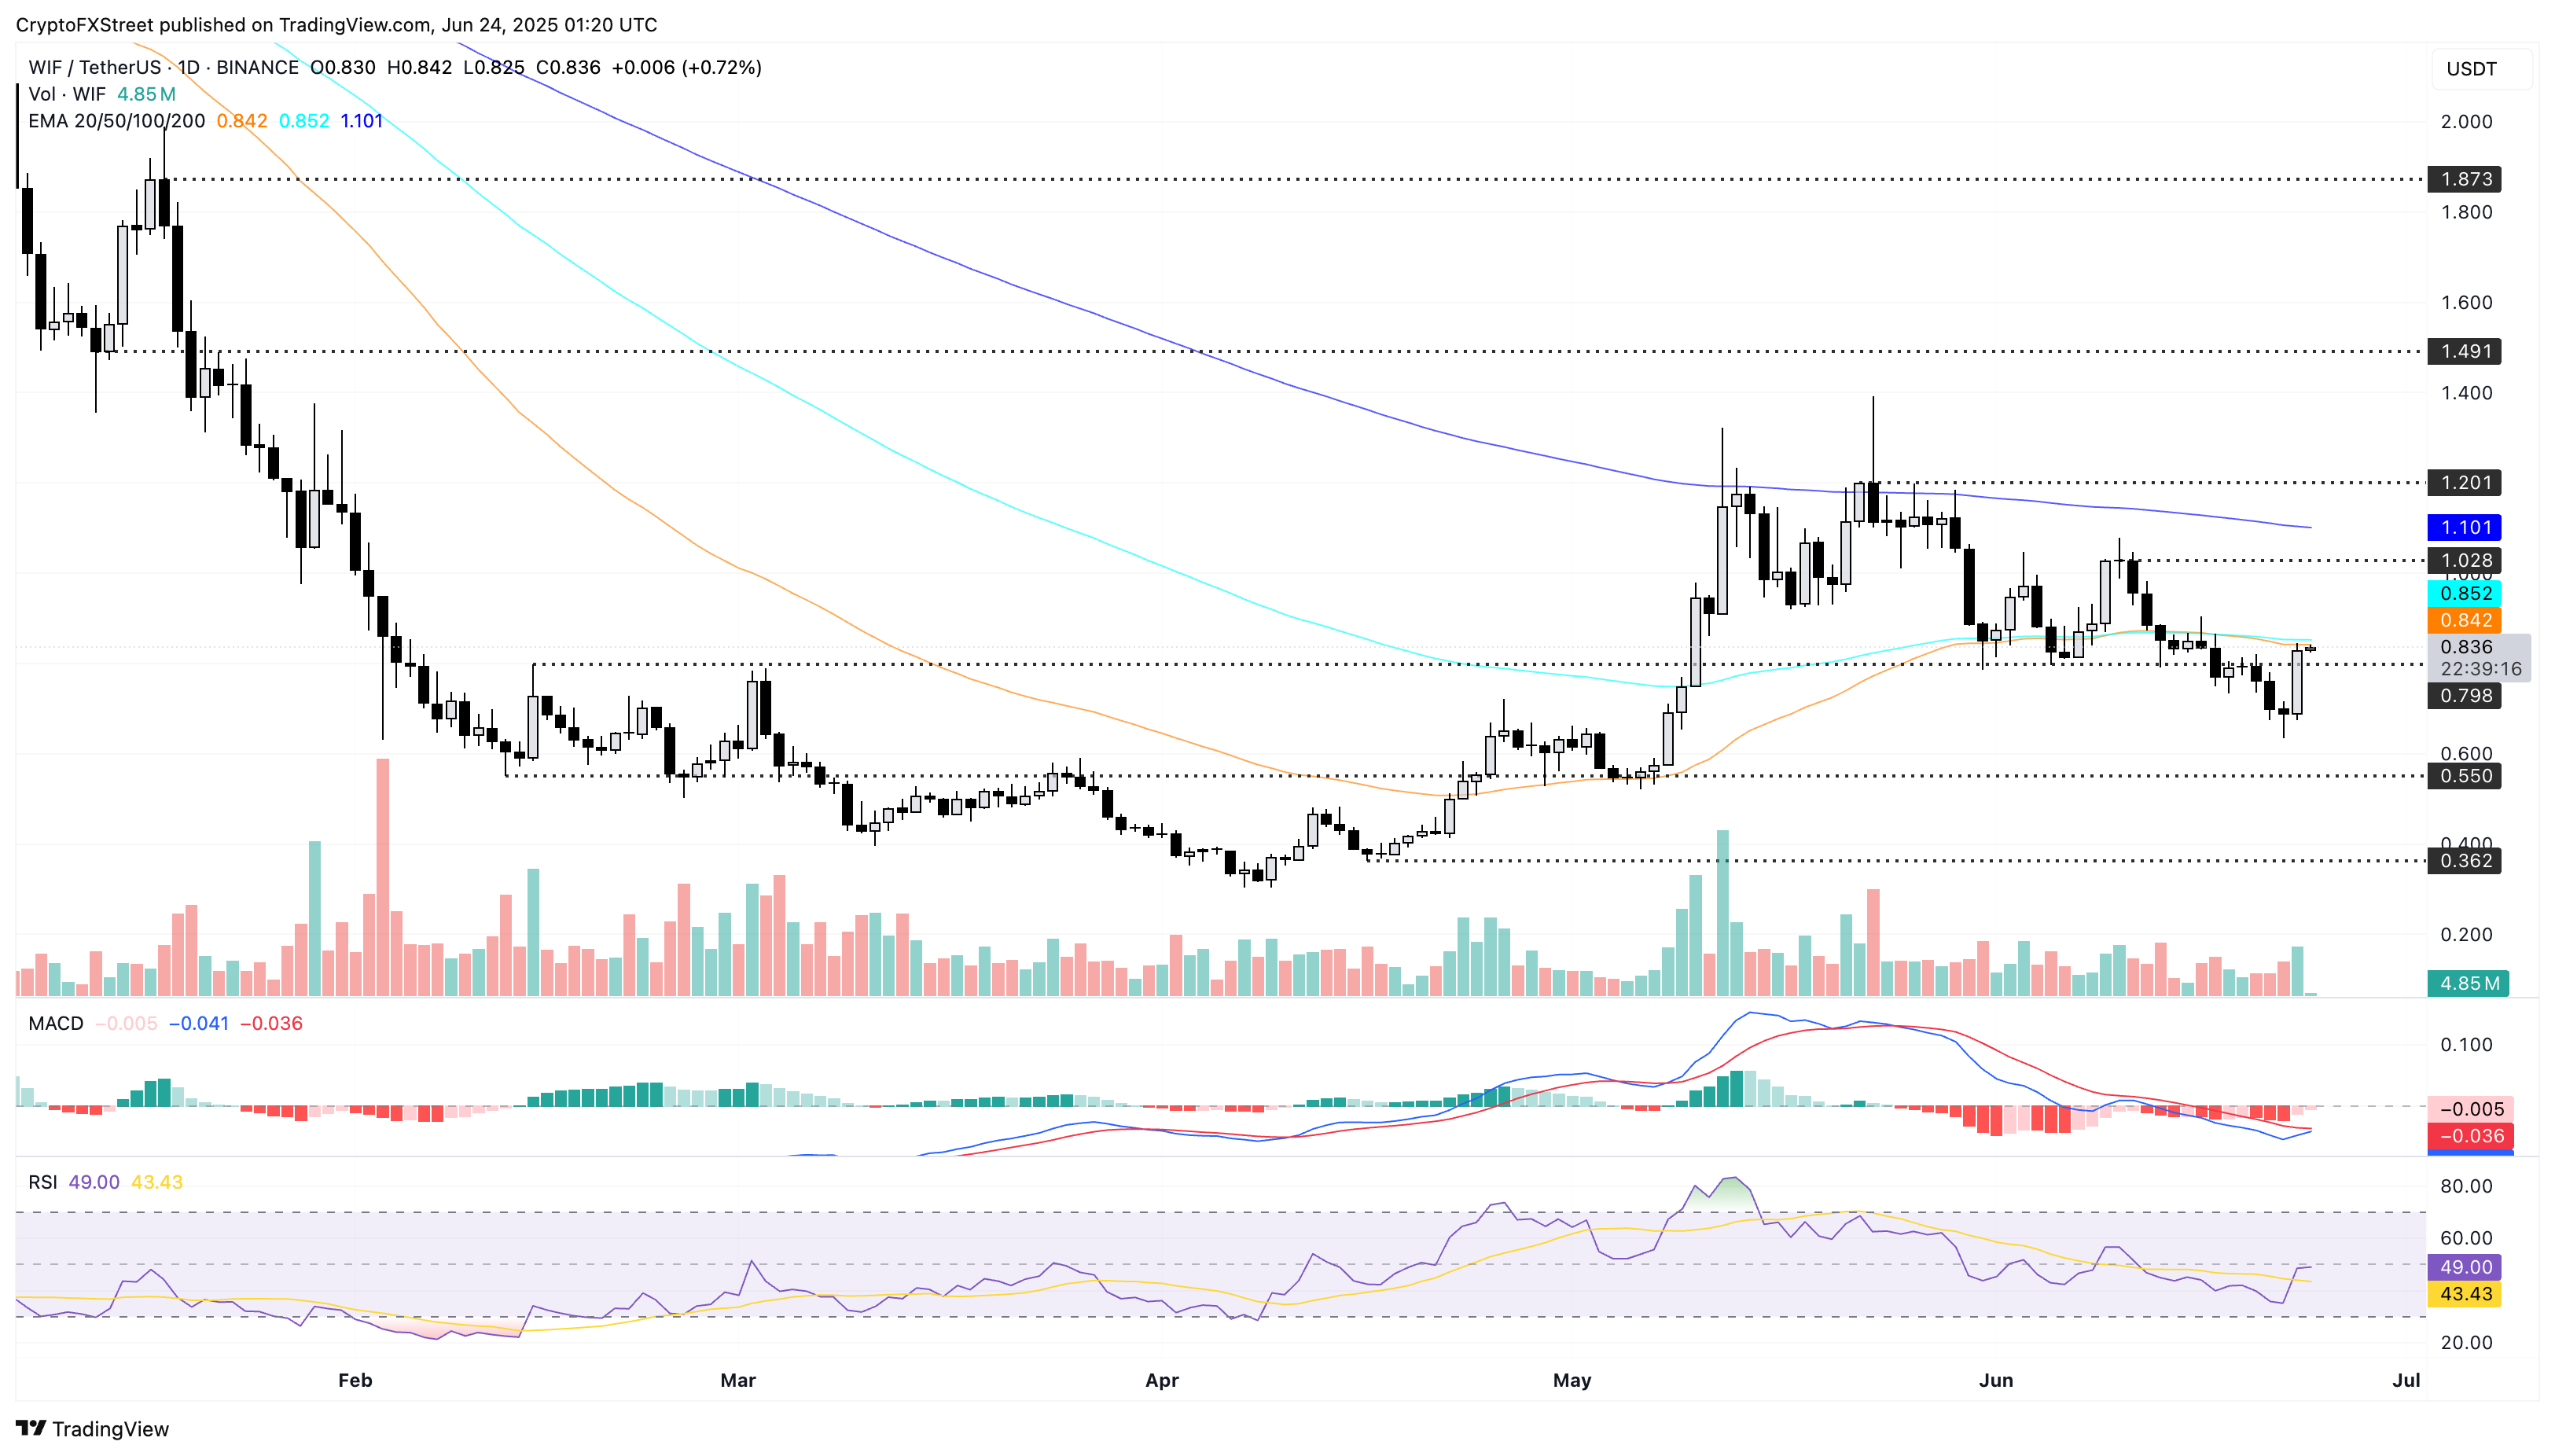
Dogwifhat edges higher at press time on Tuesday, holding the 20% gains from the previous day. A bullish engulfing candle, formed by a 20% surge, completes a morning star pattern, coupled with an 8% drop on Saturday, followed by a Doji candle.
Typically, the pattern indicates a trend reversal after a downfall, projecting upside chances for WIF. The recovery rally challenges the sideways-moving 50-day and 100-day EMAs near $0.85. A closing above the dynamic resistances could prolong the meme coin’s recovery towards the $1.00 round figure.
The MACD indicator nears its signal line, indicating a high likelihood of a potential bullish crossover that could trigger a new wave of bullish histograms from the zero line. Investors could consider the potential crossover as a trend reversal signal.
The RSI at 48 nears the halfway level, with a sharp reversal from near the oversold boundary reflecting a resurgence in bullish momentum.
WIF/USDT daily price chart.
However, a failure to mark a bullish closing above the dynamic resistances could reverse the momentum, potentially towards the weekly low of $0.63.
VIRTUAL Price Forecast: Bulls target 50-day EMA breakout
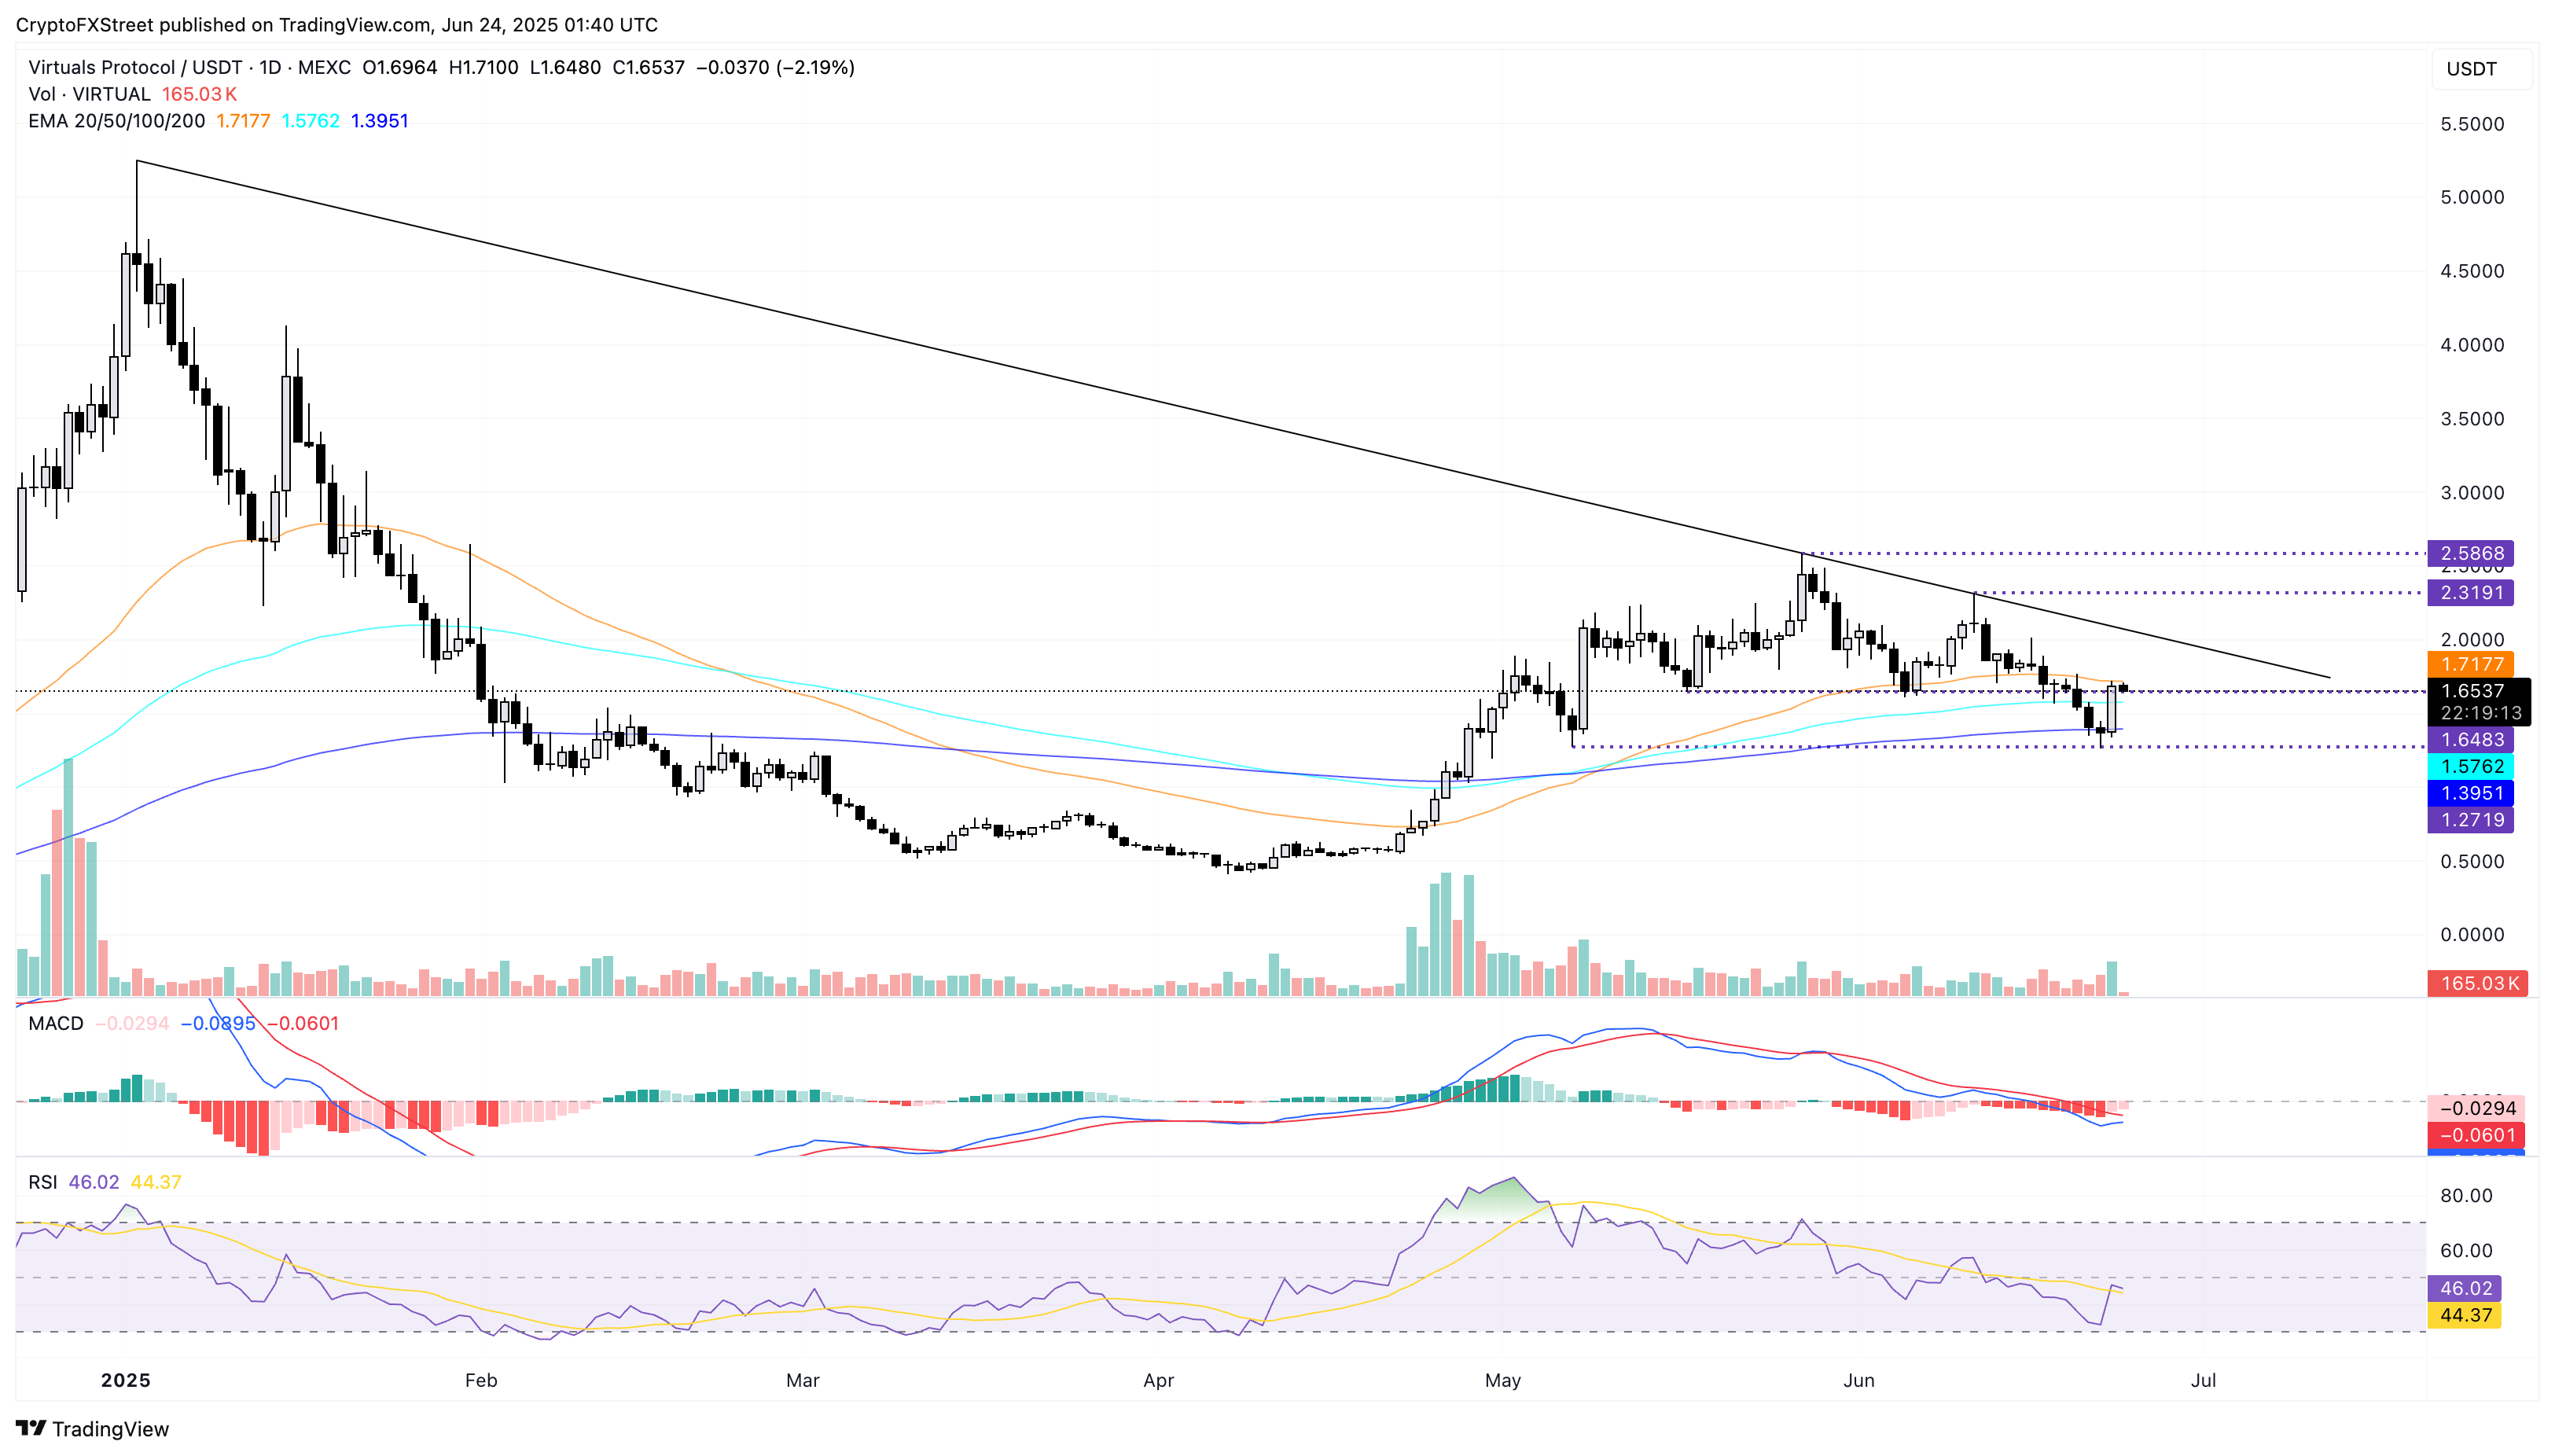
Virtuals Protocol ticks lower by 2% at press time on Tuesday following the 23% surge on Monday stemming from the 200-day EMA at $1.39. Similar to WIF, the price action prints a morning star pattern to challenge the 50-day EMA at $1.71.
A closing above the moving average could prolong the uptrend towards the overhead trendline formed by the declining highs on January 2, May 27, and June 11, near the $2.00 round figure.
The momentum exhibits a gradual bullish shift, as evident by the MACD indicator nearing a bullish crossover, with its signal line indicating a potential trendline reversal. Similarly, the RSI at 46 takes a sharp reversal towards the halfway line, indicating a boost in buying pressure.
VIRTUAL/USDT daily price chart.
If VIRTUAL fails to cross above the 50-day EMA at $1.71, it could retest the 100-day EMA at $1.57.
Author

Vishal Dixit
FXStreet
Vishal Dixit holds a B.Sc. in Chemistry from Wilson College but found his true calling in the world of crypto.


