Top Crypto Gainers: LayerZero, Axie Infinity, and Sandbox extend the bull run
- LayerZero extends gains on Friday after a 13% jump clears a psychological resistance on Thursday.
- Axie Infinity trades higher for the fourth consecutive day by nearly 7%, approaching the $3 mark.
- Sandbox is up 4% above the 100-day EMA on Friday, extending 14% rise from the previous day.

LayerZero (ZRO), Axie Infinity (AXS), and Sandbox (SAND) extend gains on Friday, outrunning the broader cryptocurrency market over the last 24 hours. The renewed demand for gaming tokens and the sustained recovery in ZRO signal an upside bias.
LayerZero’s bullish turnaround gains traction
LayerZero is up 3% at press time on Friday, extending the 13% rise from the previous day. The cross-chain messaging token rallies for the fifth consecutive day, lifting the 50-day Exponential Moving Average (EMA) to $1.56 and the 100-day EMA to $1.58, signaling short-term strength and approaching a potential crossover.
Technical indicators on the daily chart suggest intense bullish momentum approaching overbought levels. The Relative Strength Index (RSI) at 86 rises into the overbought zone, and the Moving Average Convergence Divergence (MACD) and signal line move higher as the histogram widens above zero.
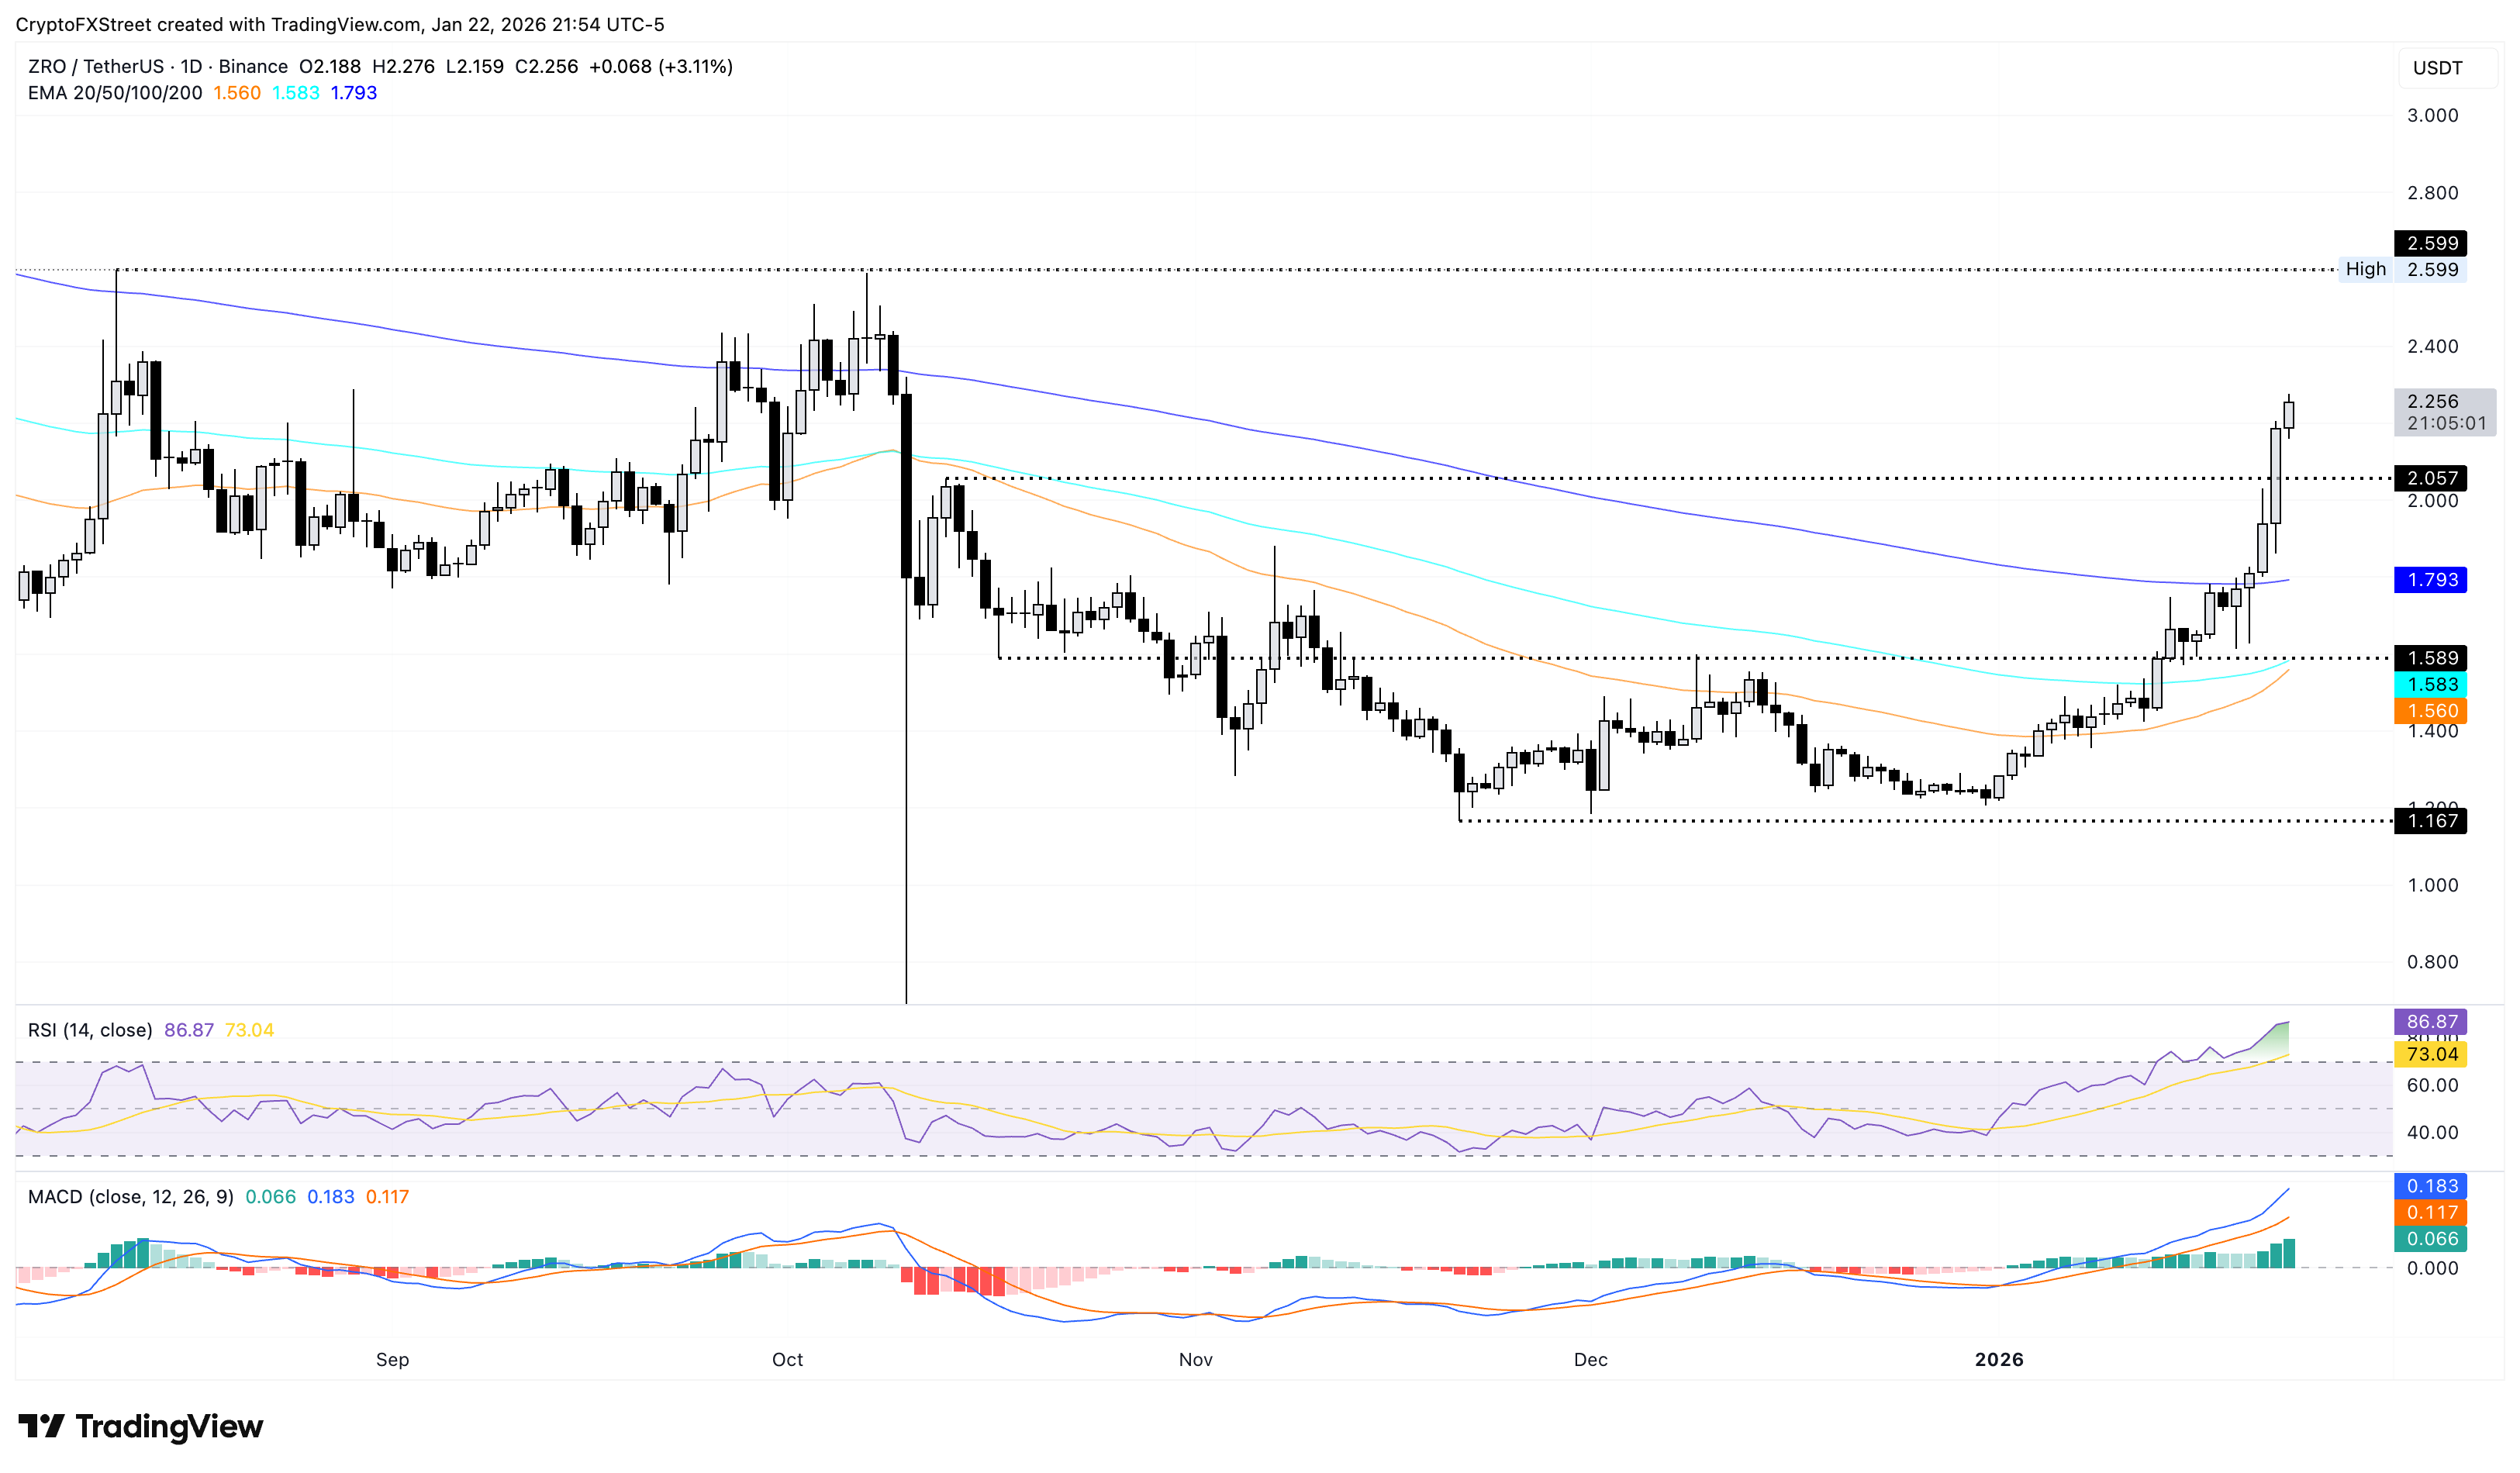
LayerZero’s rally could face opposition at the $2.59 mark, aligning with the August 11 high.
Axie Infinity inches closer to surpassing the $3 mark
Axie Infinity rallies over 250% so far this month, approaching the $3 mark. At the time of writing, AXS is up nearly 7% on Friday, facing headwinds at the 78.6% Fibonacci retracement level at $2.92, measured from the May 15 high to the December 17 low at $3.51 and $0.75, respectively.
A decisive close above this level could open the door for a move above the $3 mark, potentially targeting the $3.51 high.
Technical indicators on the daily chart signal intense buying pressure as the RSI at 82 flashes overbought conditions and the MACD’s parabolic rise is accompanied by successively rising histogram bars above zero.
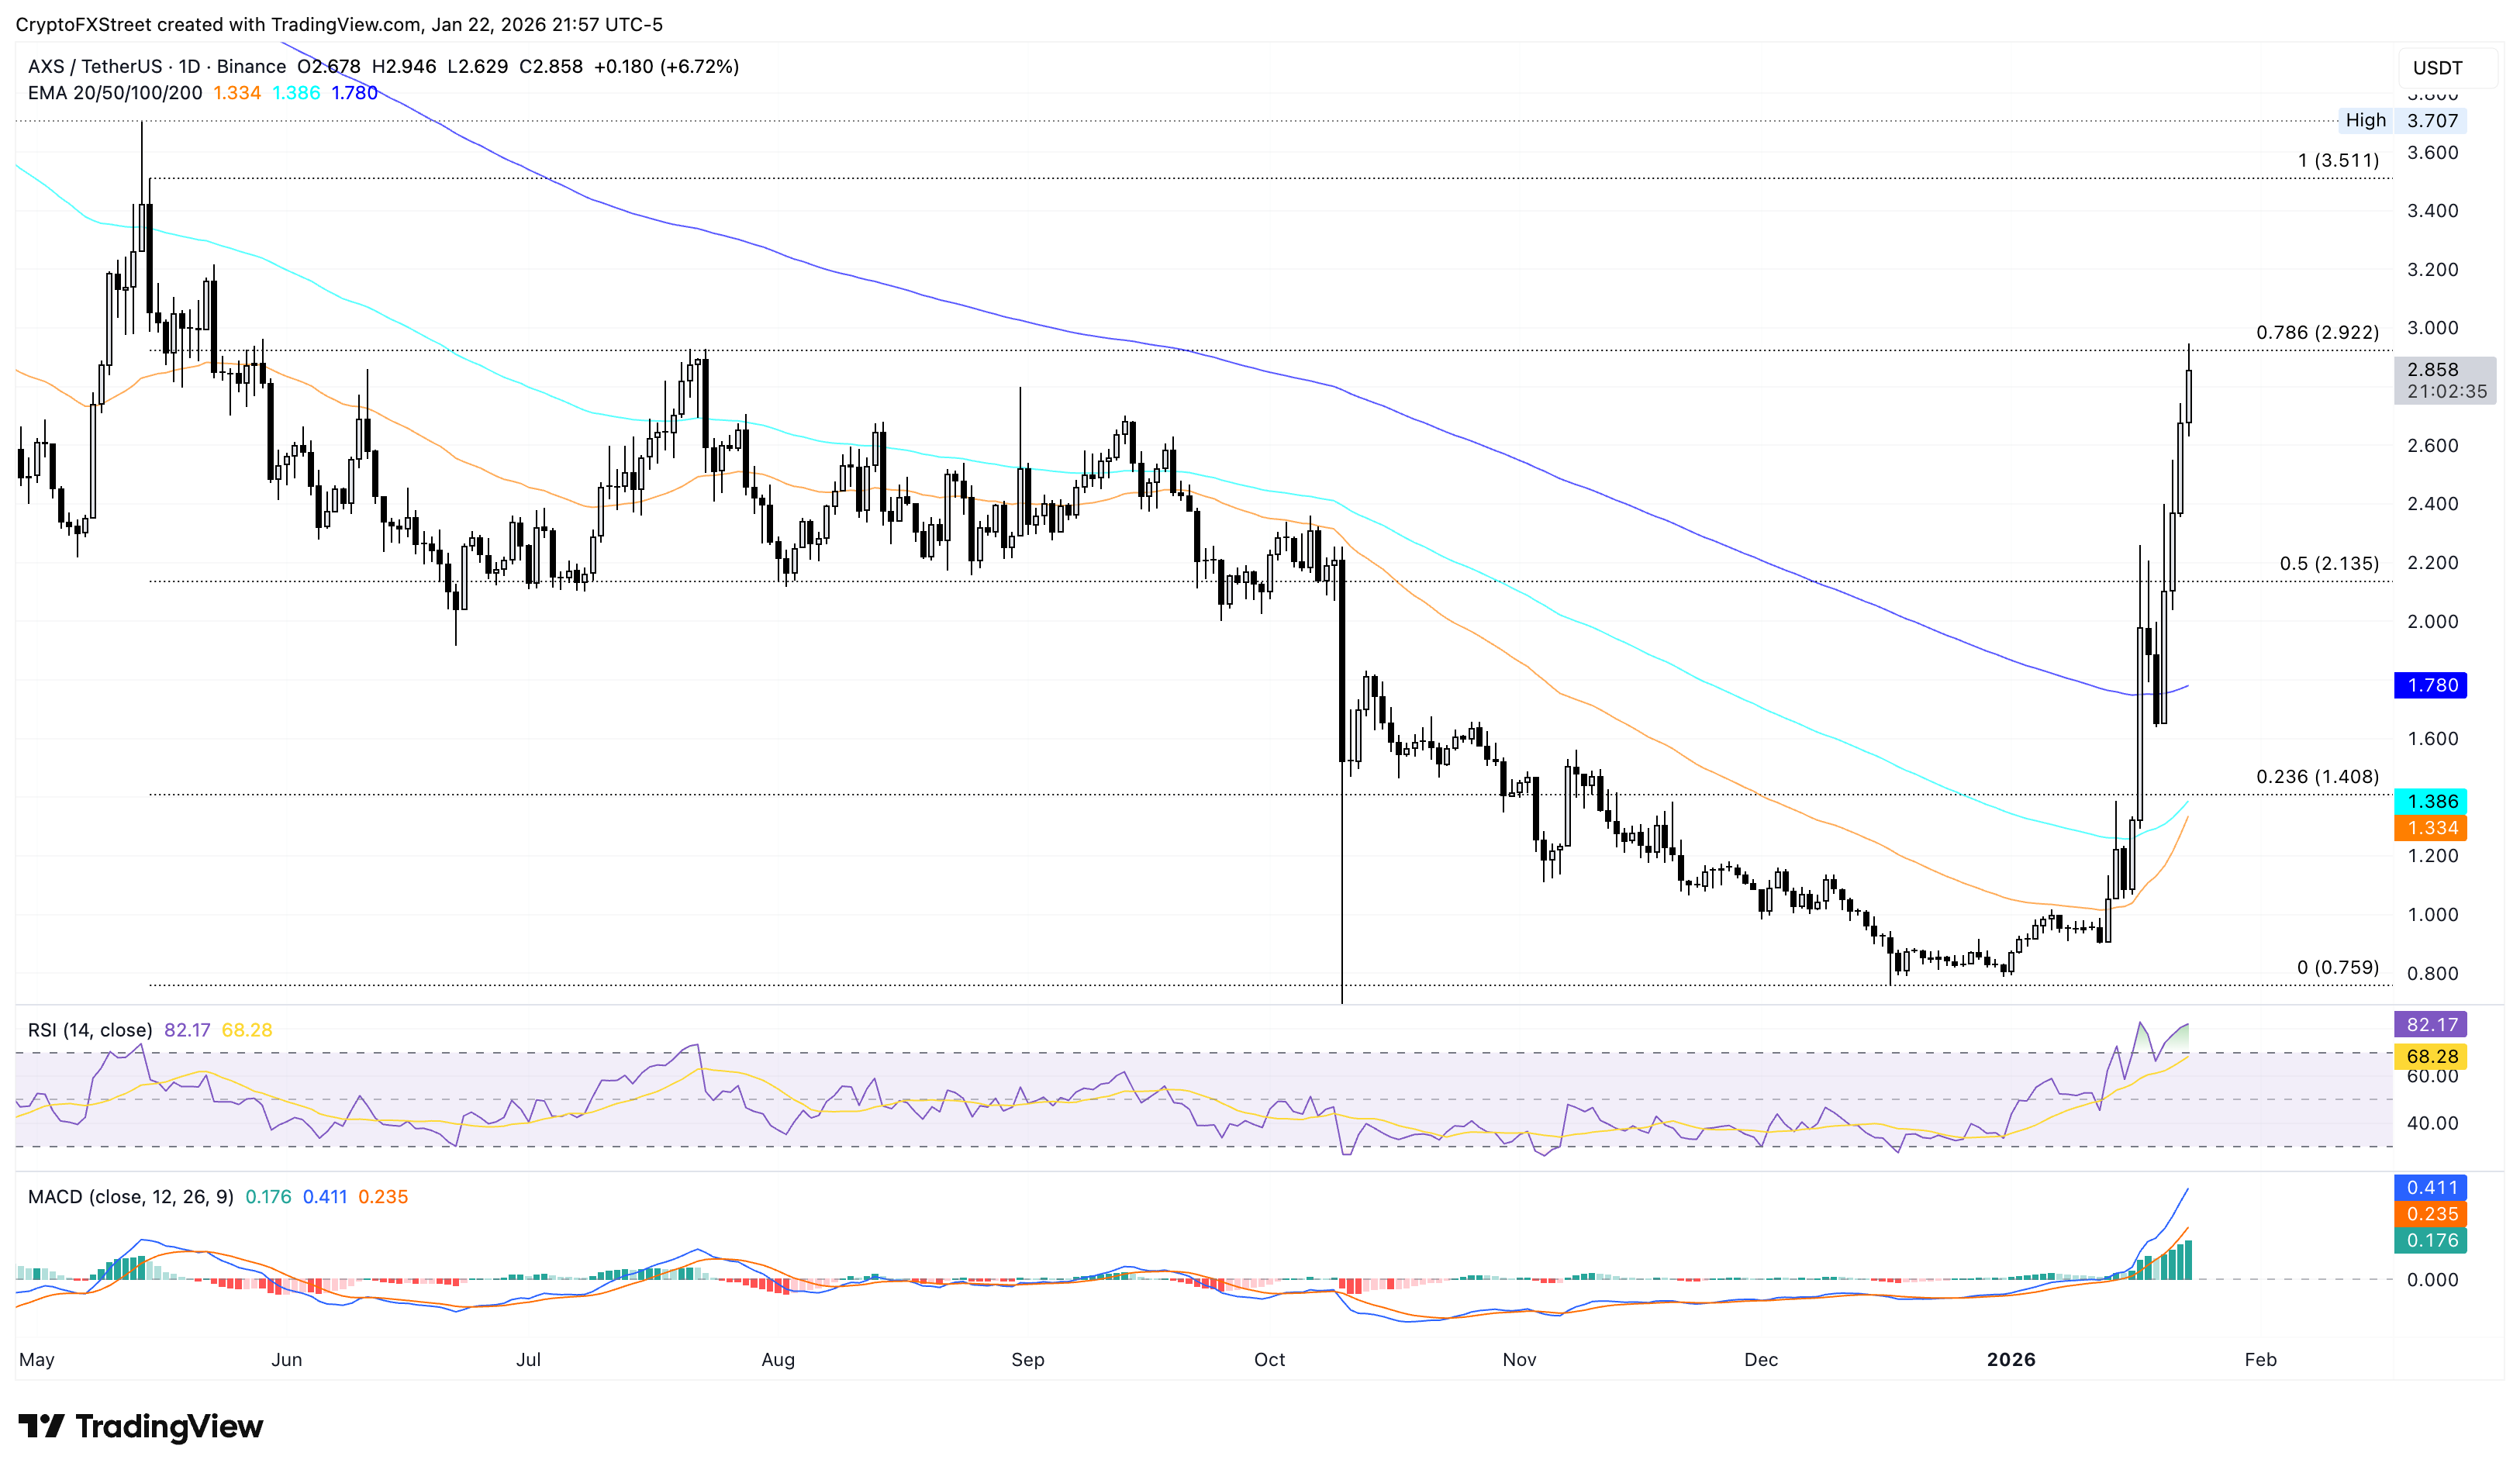
On the flipside, a reversal in AXS from $2.92 would flash a downside risk toward the 50% retracement level at $2.13.
Sandbox rally targets the 200-day EMA
Sandbox extends the recovery run by 4% above the 100-day EMA at $0.1598 at the time of writing on Friday. The gaming token aims for the 200-day EMA at $0.2027 as it clears the $0.1623 resistance level marked by the November 4 low.
Like other top gainers, momentum indicators signal an upside bias in Sandbox. The RSI is at 71 on the daily chart, stepping into the overbought zone, while MACD and the signal line extend an upward trend, with the histograms rising above zero.
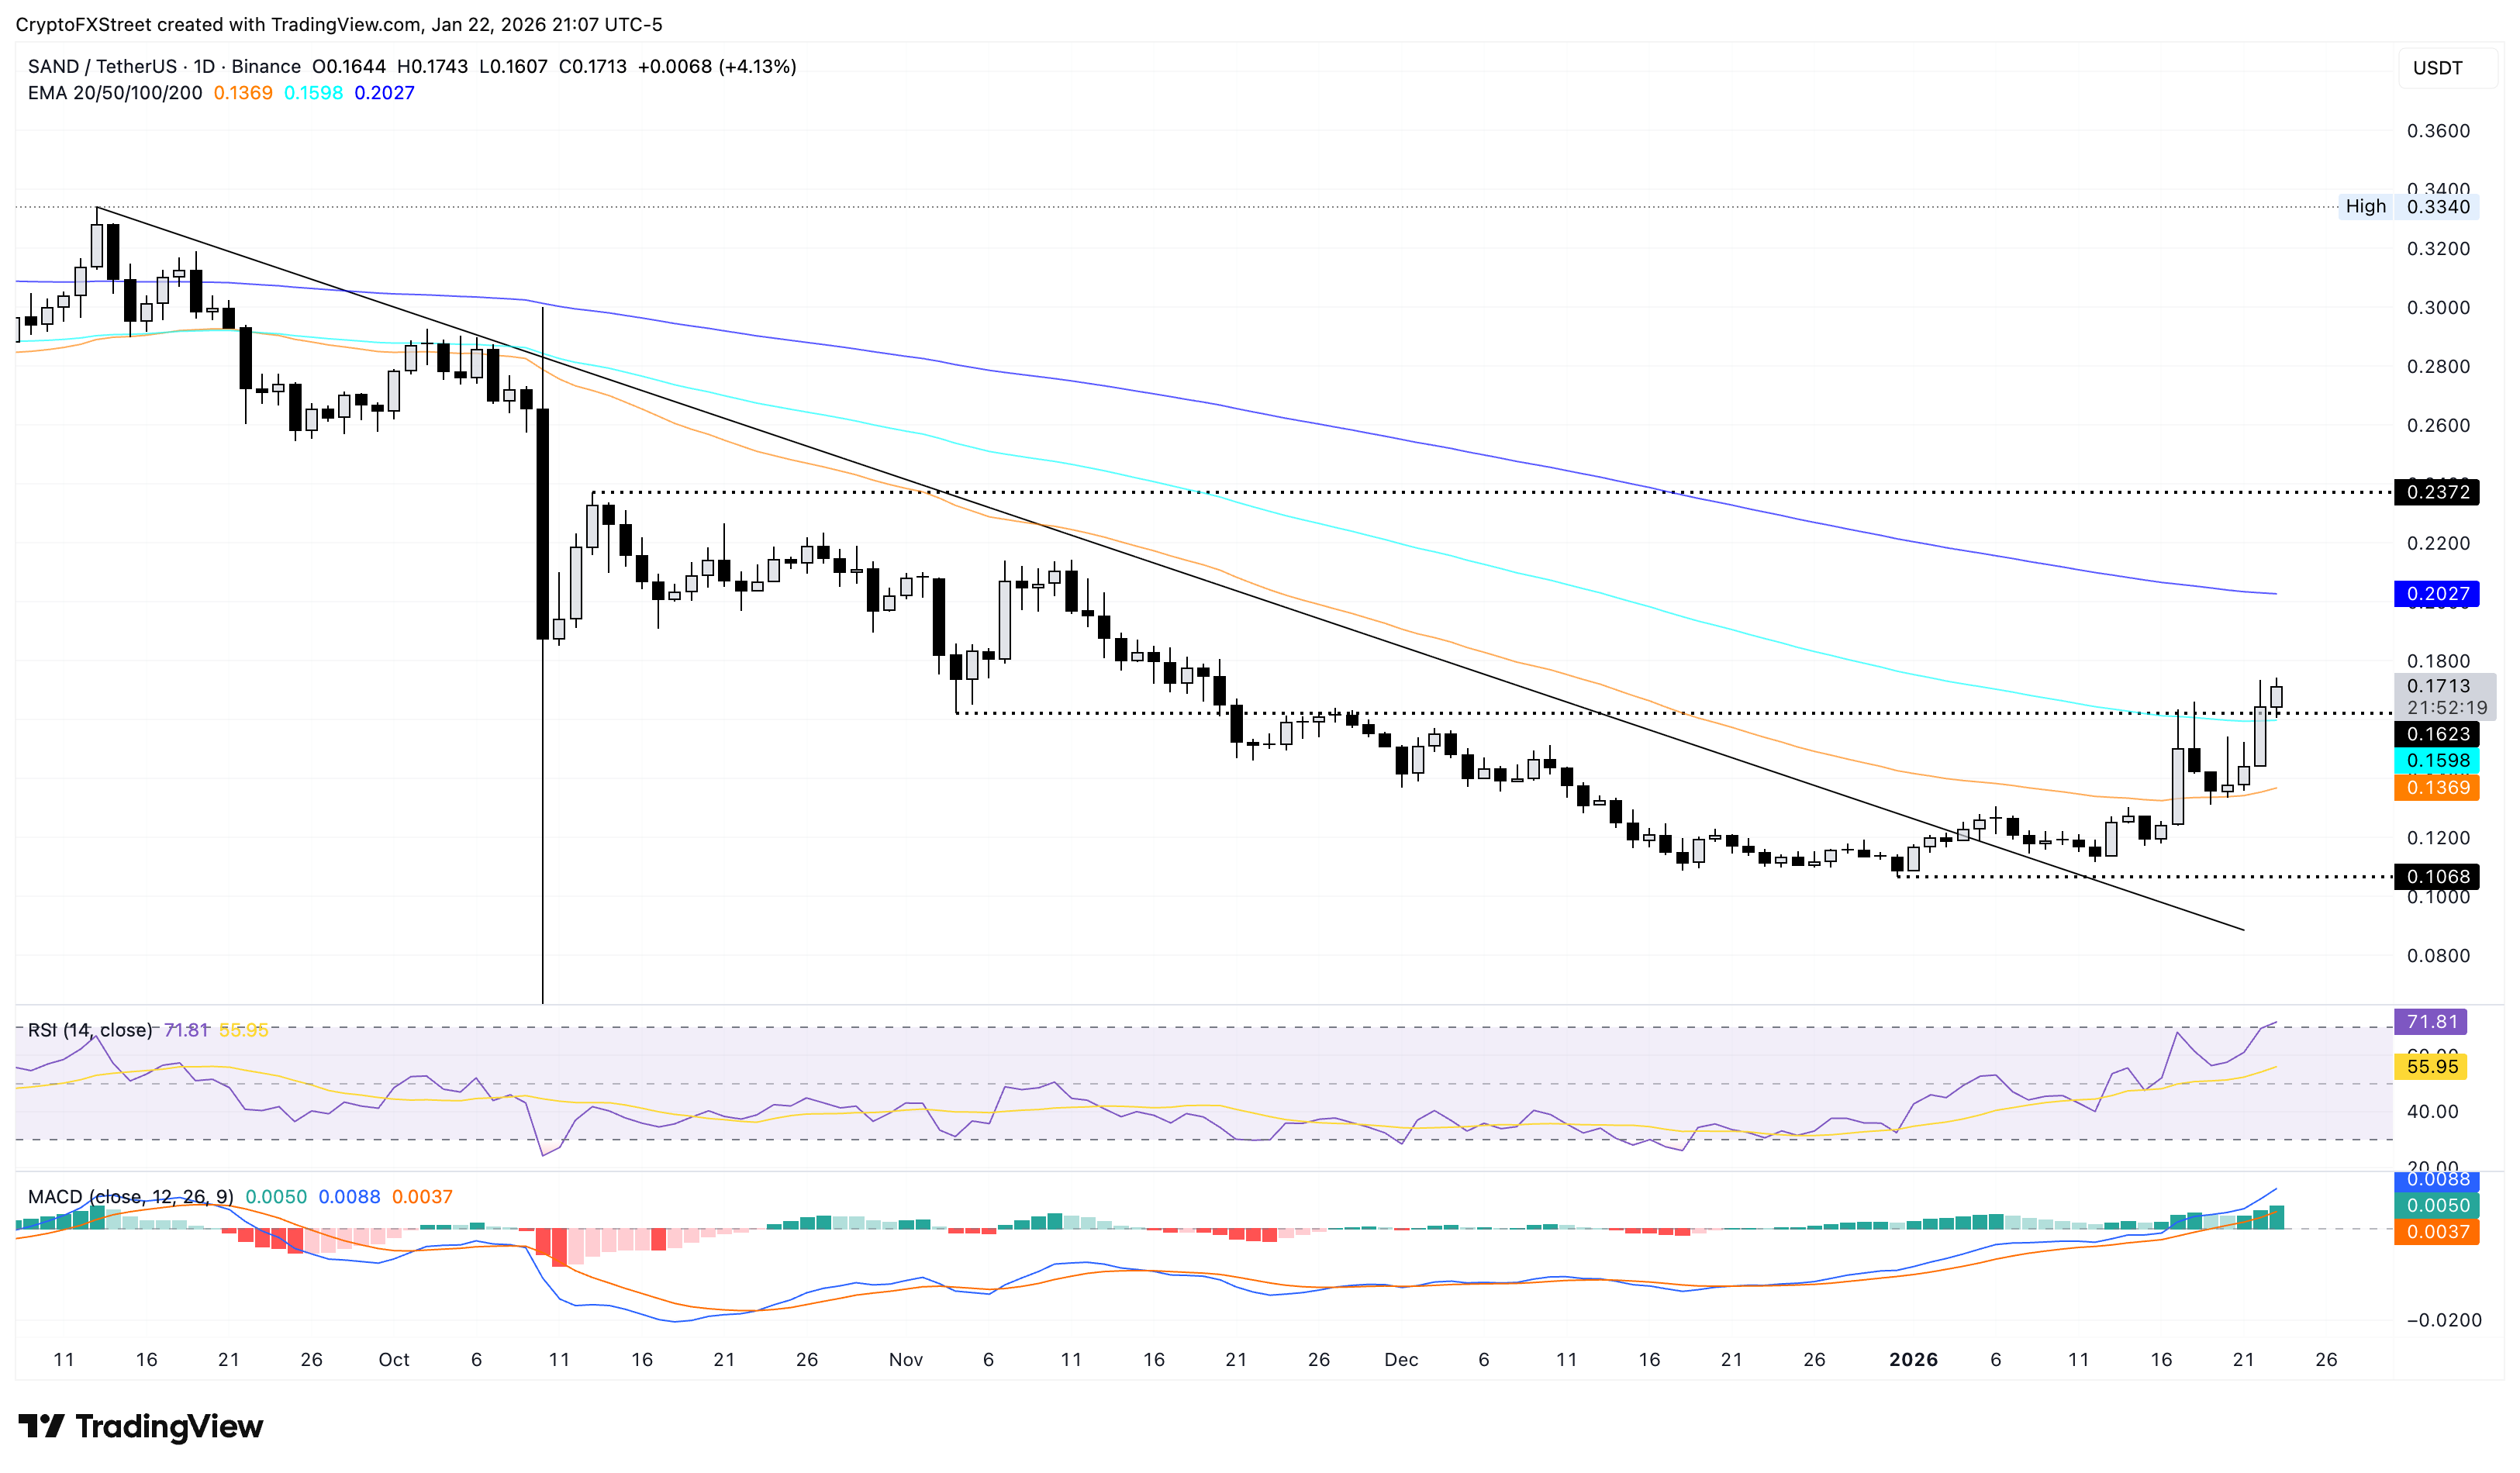
However, if SAND drops below $0.1598, the 50-day EMA at $0.1369 could serve as the immediate support level.
Author

Vishal Dixit
FXStreet
Vishal Dixit holds a B.Sc. in Chemistry from Wilson College but found his true calling in the world of crypto.


