Top Crypto Gainers: Decred, Internet Computer, and Quant rebound to key resistance levels
- Decred rally takes a breather near $50, risking a potential reversal.
- Internet Computer struggles to hold ground above the $6 mark.
- Quant’s 18% rebound in a falling channel on Wednesday signals renewed bullish momentum.

Decred (DCR), Internet Computer (ICP), and Quant (QNT) rank as top performers in the last 24 hours with double-digit gains as the broader cryptocurrency market recovers after Tuesday’s correction. Despite the rebound in DCR, ICP, and QNT, the technical outlook remains mixed as the altcoins approach key resistance levels.
Decred rally fizzles out at $50, risking a bearish reversal
Decred has recorded over 120% gains so far this week as the broader market experienced a capital rotation towards privacy coins. At the time of writing, Decred trades at above $40, struggling to surpass the $50 psychological resistance zone.
The reversal from $50 risks breaking below the local support trendline on the 4-hour price chart at $40, which is formed by connecting the lows of Monday and Wednesday. A decisive close below $40 could extend the decline to Wednesday’s low at $28.50.
The momentum indicators on the 4-hour chart indicate a decline in buying pressure, as the Relative Strength Index (RSI) at 60 slopes downward from the overbought zone. Similarly, the Moving Average Convergence Divergence (MACD) retraces to the signal line, risking a crossover, which could confirm a renewed bearish trend.
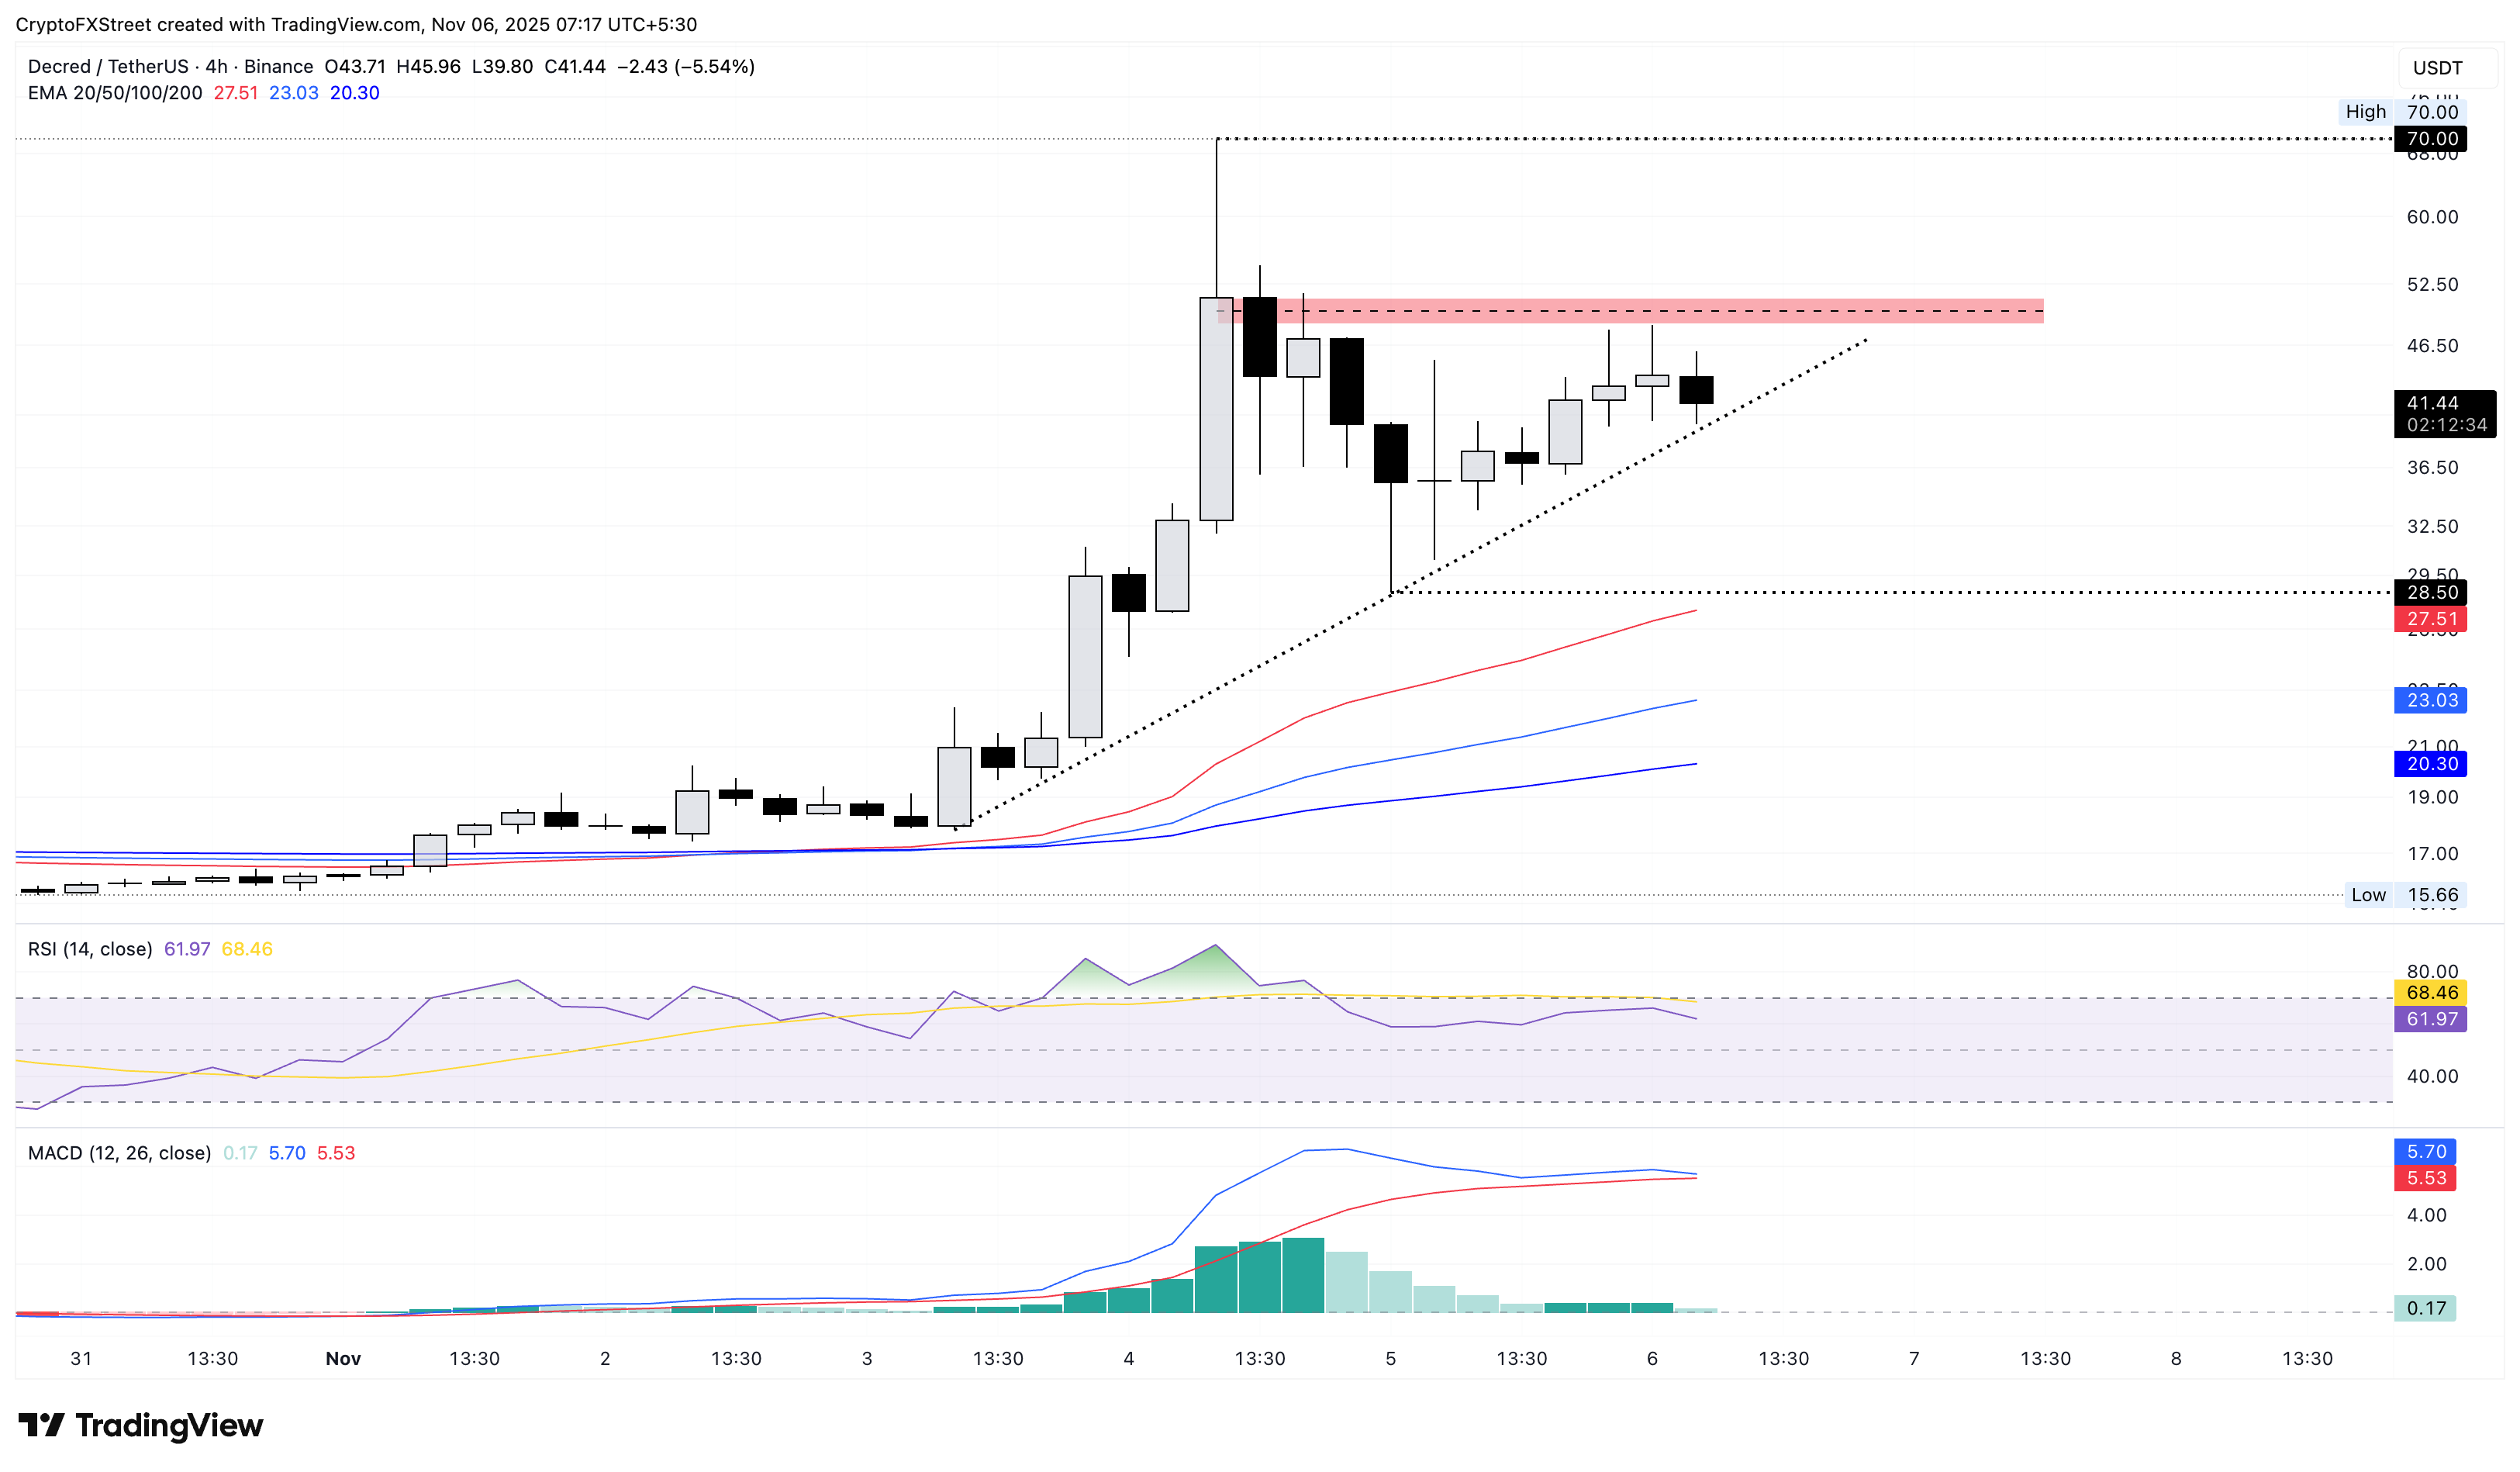
If DCR extends the rally above $50, it could test the $70 high from Tuesday.
Internet Computer rally risks exhaustion
Internet Computer extended the rally by 14% above the 200-day Exponential Moving Average (EMA) on Wednesday. Still, the ICP token edges lower by 2% at press time on Thursday, toiling to sustain above the $6 mark.
The intraday pullback risks retesting the 200-day EMA at $5.017 if the buying pressure fails to absorb the overhead supply.
Technically, the RSI at 70 indicates an overbought condition, while the MACD and signal lines extend the uptrend, accompanied by laddering green histogram bars from the zero line. This suggests that the strong bullish momentum could be reaching a potential top.
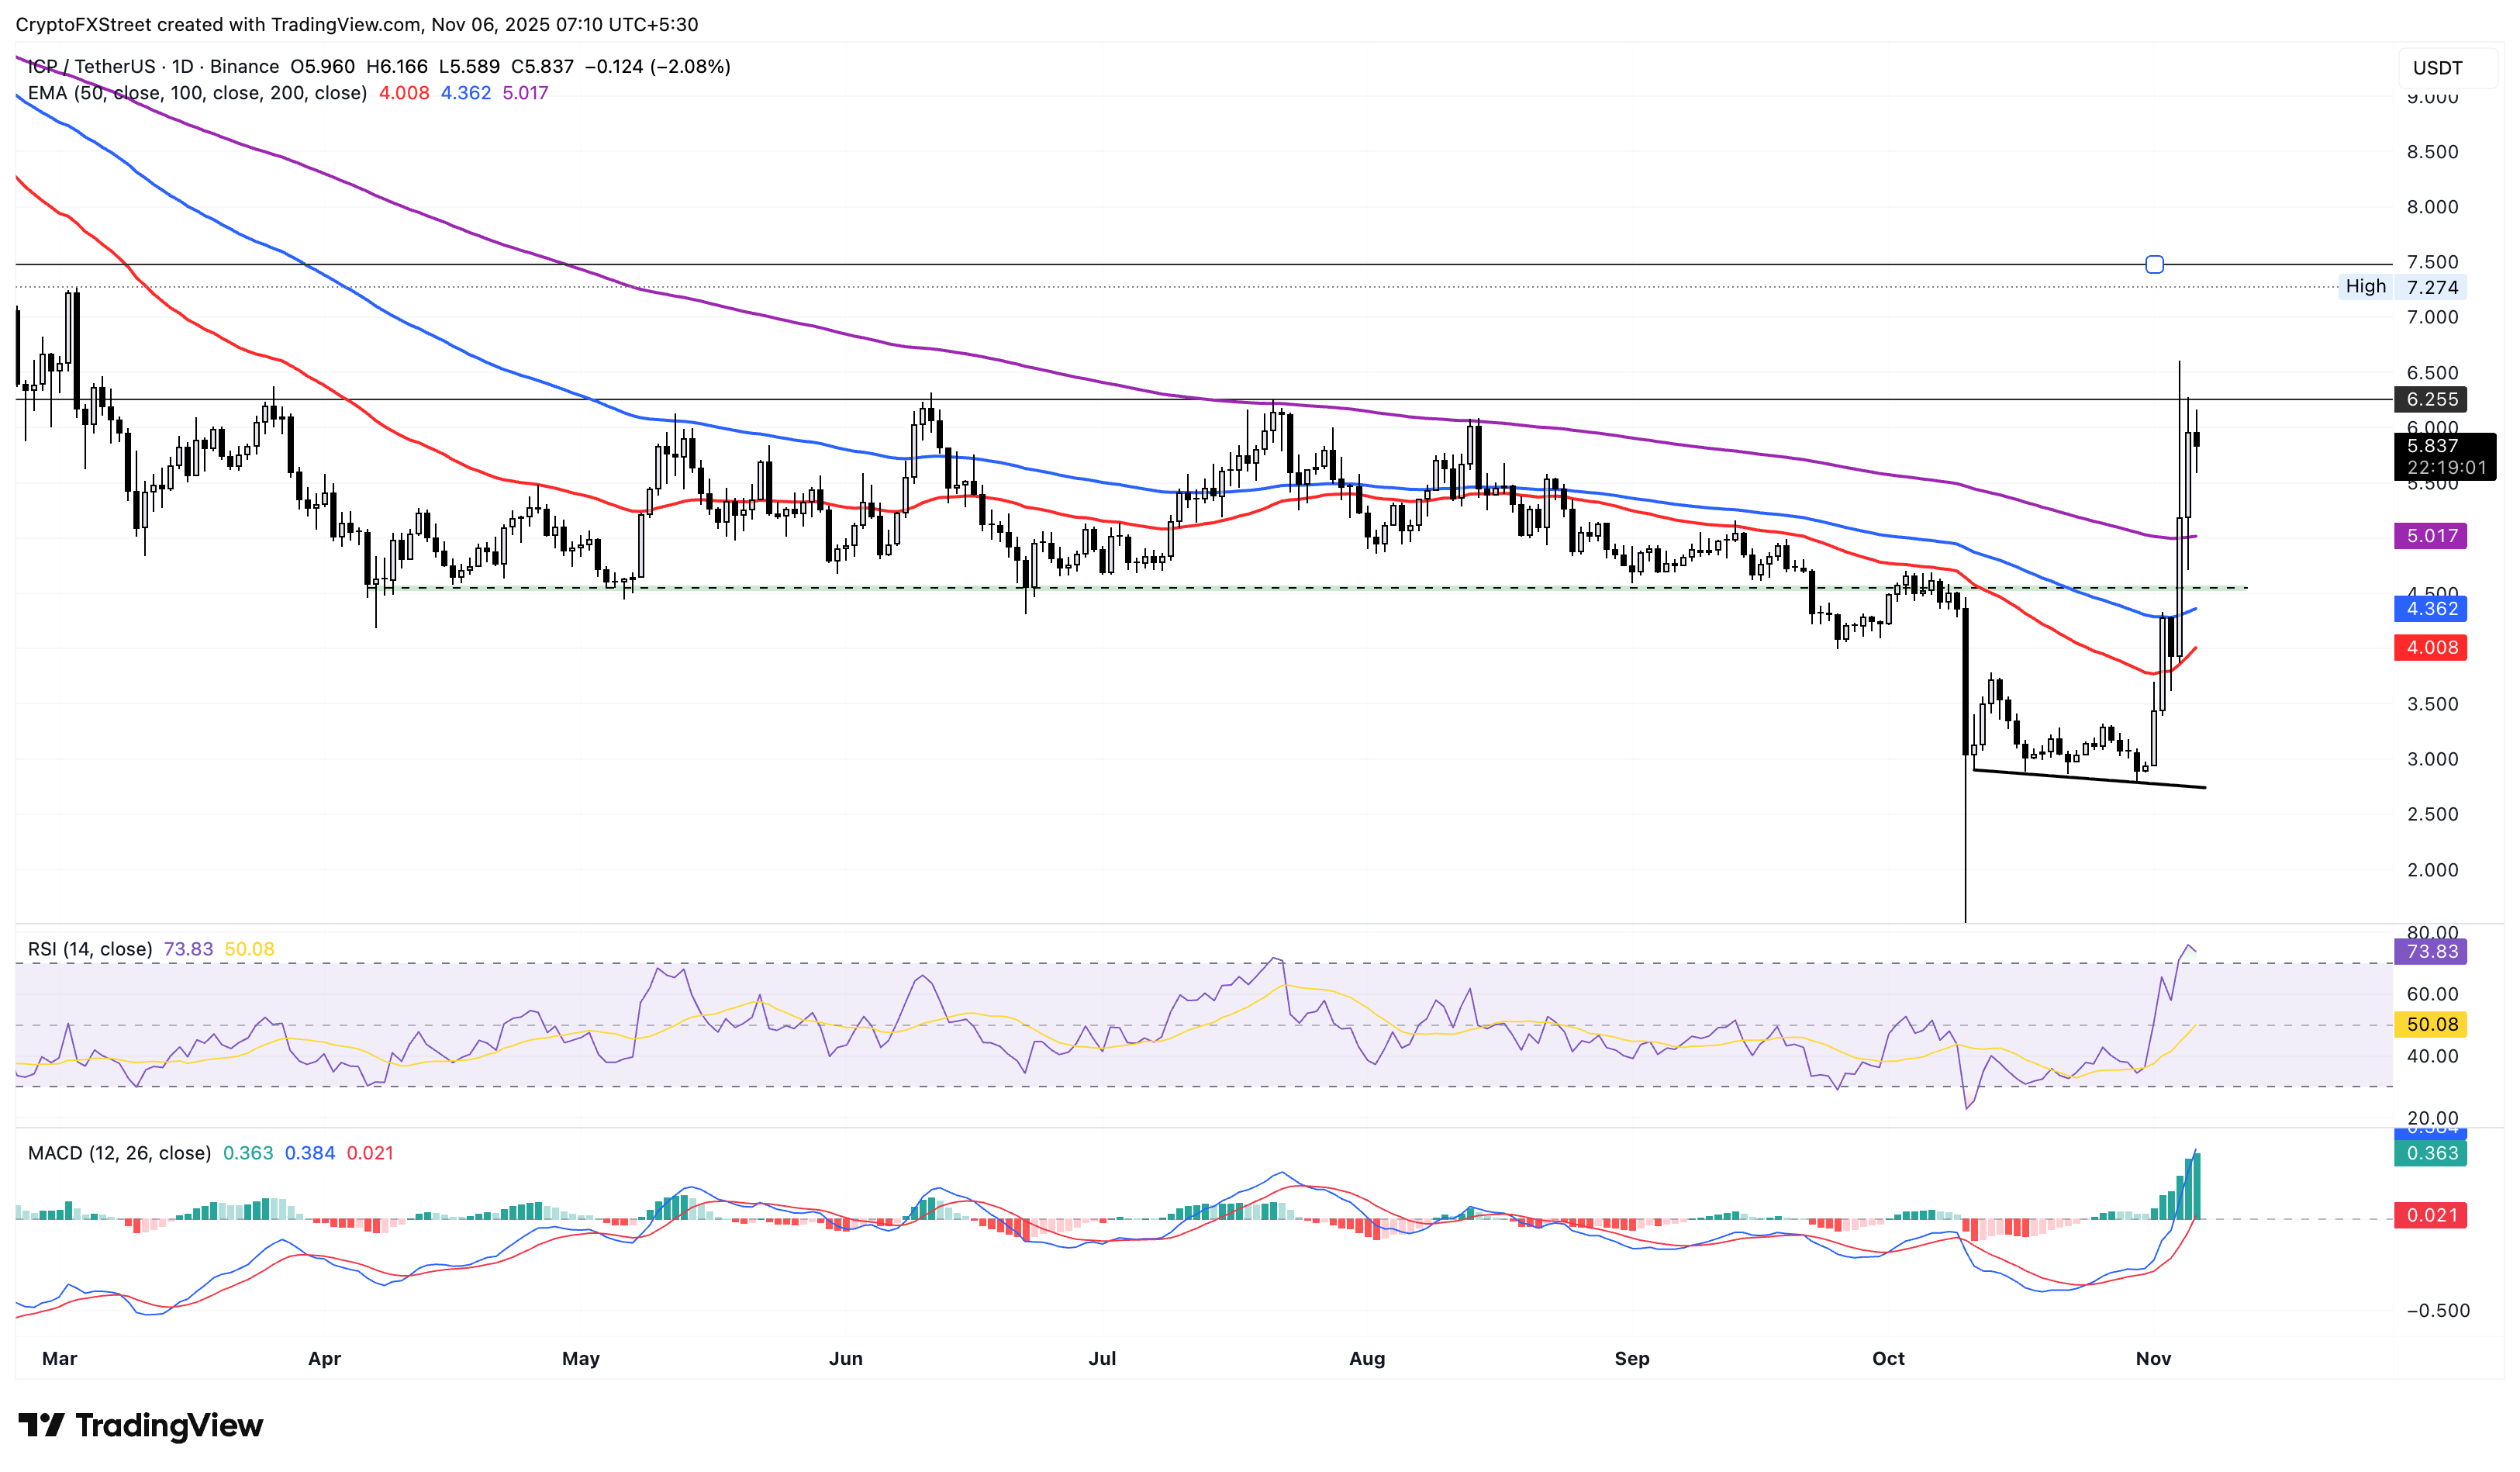
Looking up, a potential daily close above the June 21 high of $6.255, ICP could extend the rally to the February 12 high of $7.478.
Quant’s upcycle in a falling channel eyes further gains
Quant trades near $85.00 at press time on Thursday, taking a breather after the 18% jump on the previous day. The rebound in QNT within a larger falling channel pattern on the daily chart faces opposition from the declining 50-day EMA at $88.75.
A decisive close above $88.75 could test the 200-day EMA at $96.69, near the falling channel’s resistance trendline.
The RSI at 51 shows a rebound above the halfway point from the oversold zone, while the MACD crossed above the signal line on Wednesday. This suggests that the buying pressure is resurfacing in Quant.
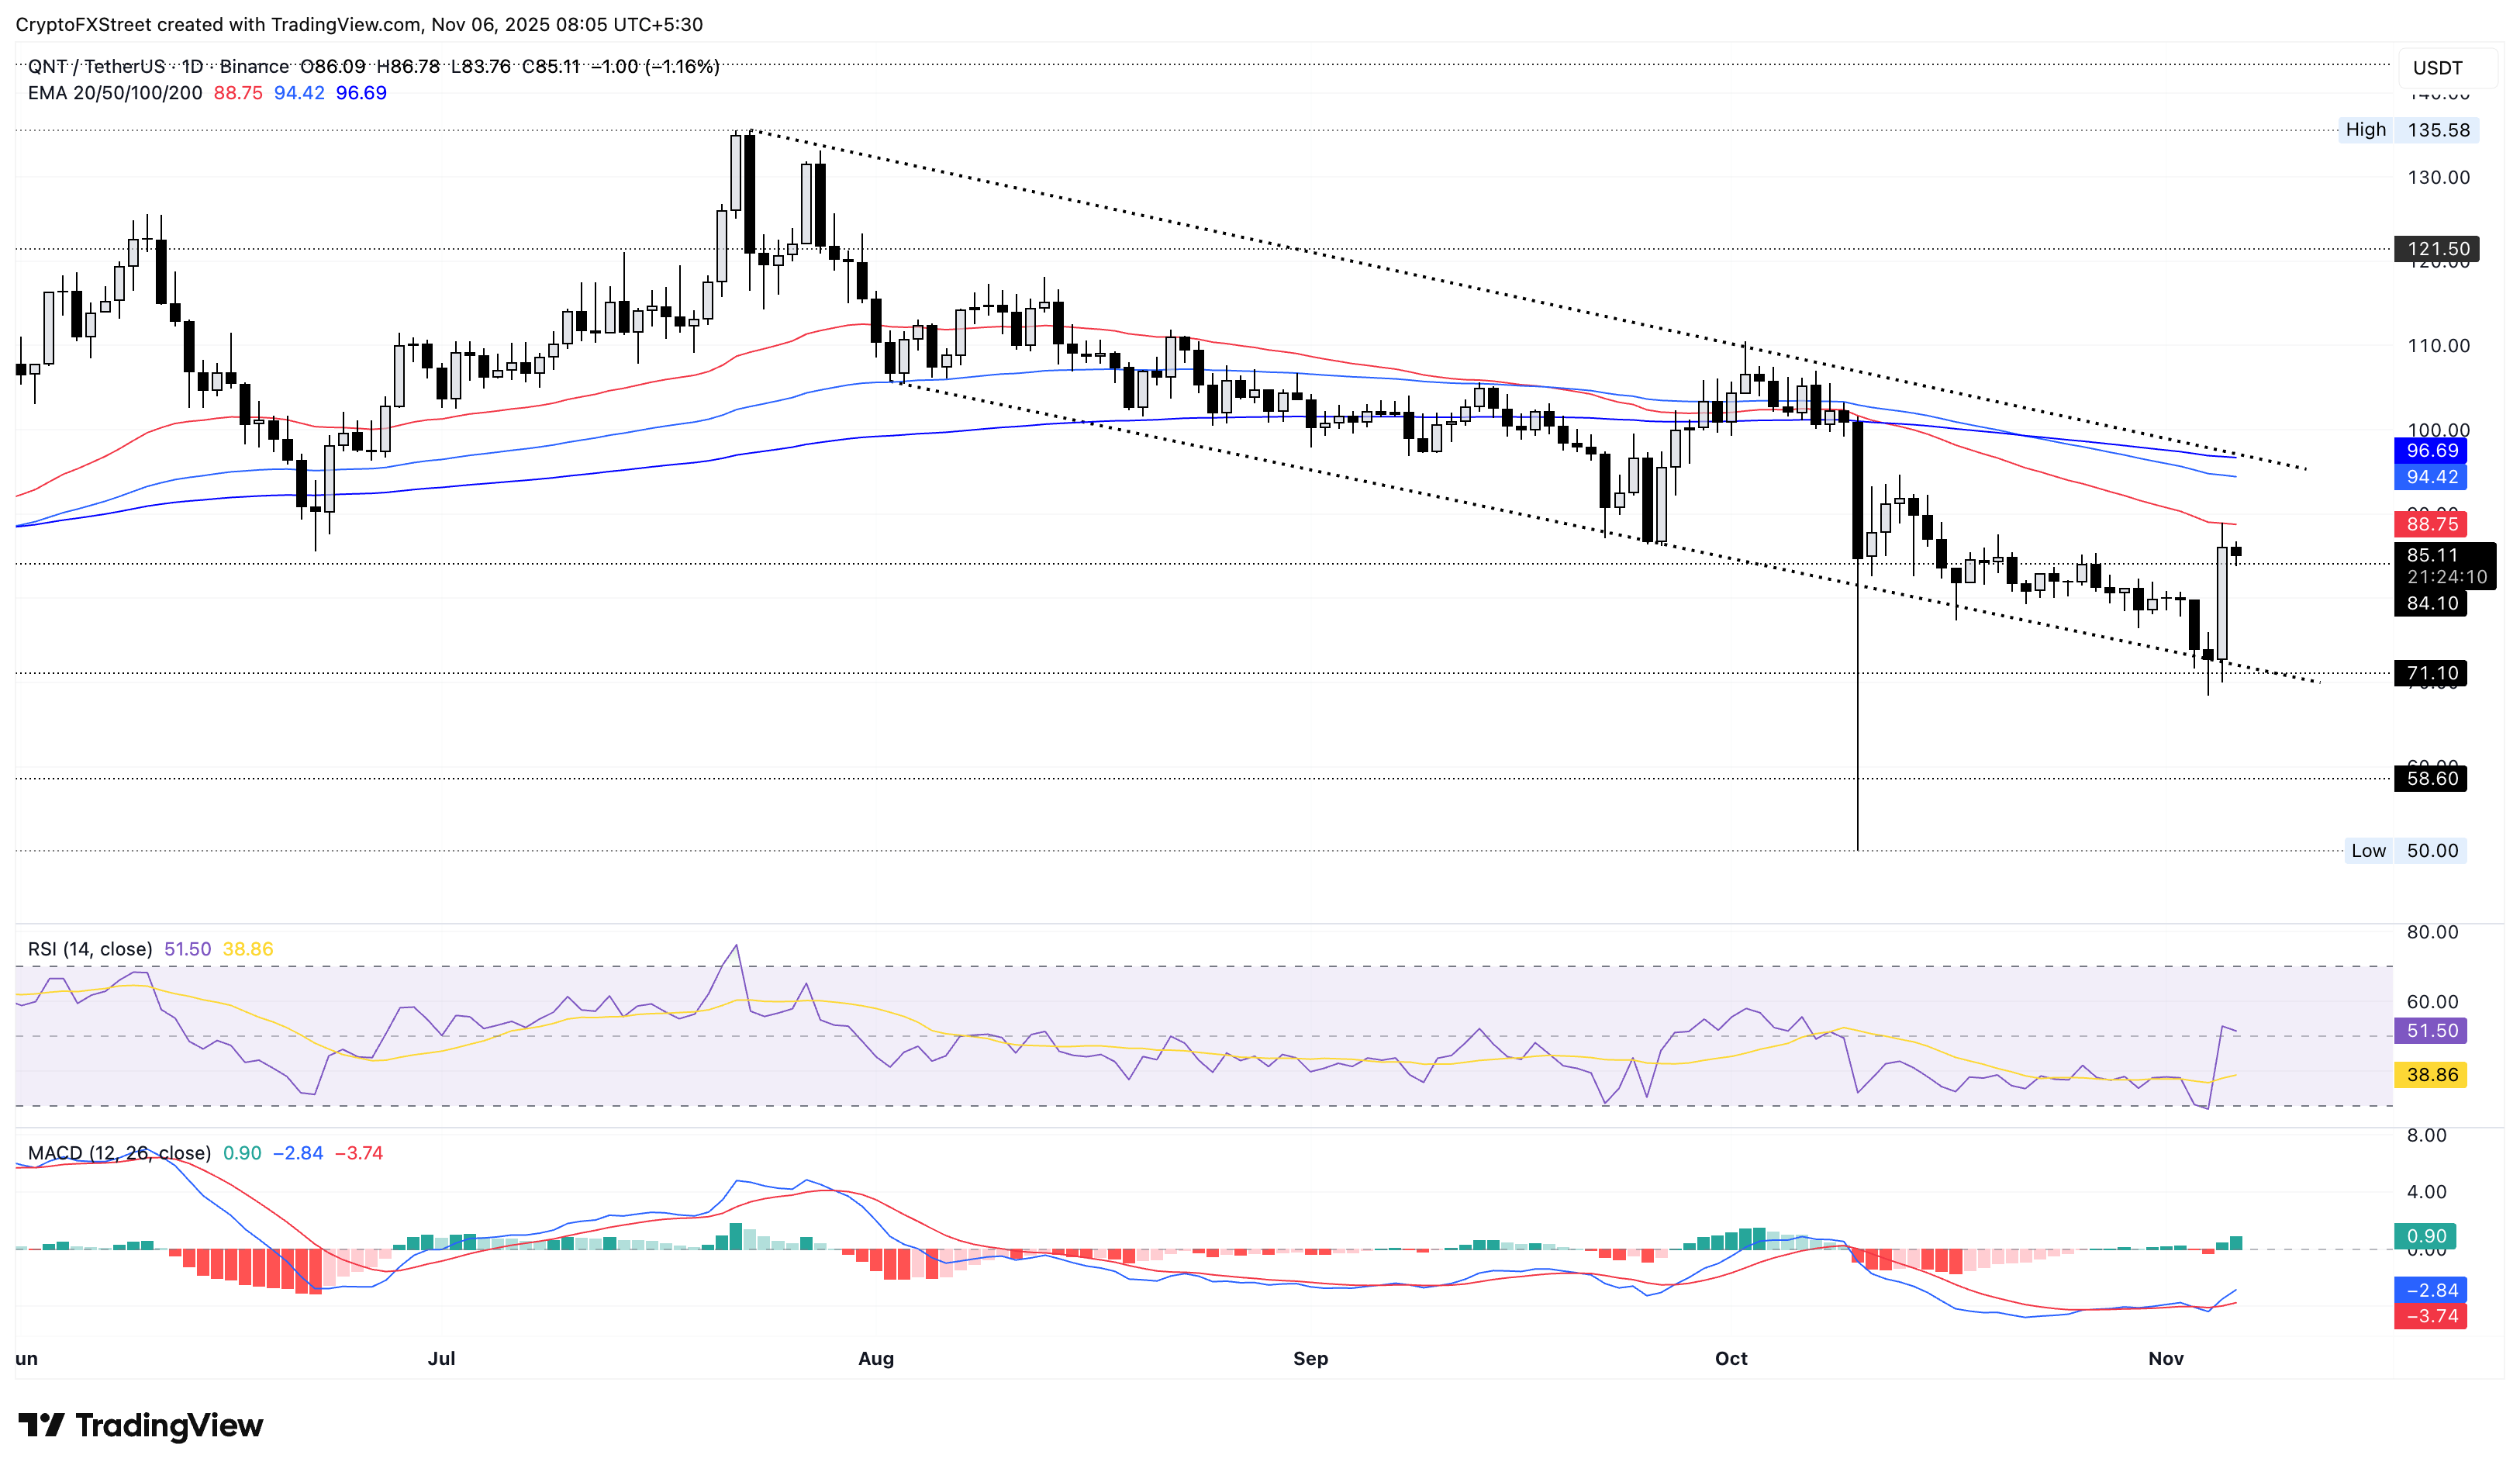
If QNT fails to exceed the 50-day EMA, it could retrace towards the support trendline near $71.10.
Author

Vishal Dixit
FXStreet
Vishal Dixit holds a B.Sc. in Chemistry from Wilson College but found his true calling in the world of crypto.


