Top 3 Price Prediction Bitcoin, Ripple, Ethereum: XRP surprises and presents its candidacy to lead the market
- XRP is set on the rise with a target of $0.55.
- ETH moves away from optimal bullish momentum.
- BTC takes it easy, it's the King.

We are at the halfway point of the week, and as European Cryptocurrencies, traders take their places the markets are insinuating a new bullish tranche. It is in this type of environment where it is easier to be carried away by emotions or impulses and make decisions without there being a justified reason to do so.
In the analysis I published yesterday, I declared that a new bullish momentum was being prepared, with the necessary collaboration of the Ethereum and the doubt whether the XRP would take part in the party or still seem to be dancing alone. Well, surprise! With the passing of the hours the XRP graph has been improving and right now is, among the Top 3, the best positioned to take the baton to the top.
The technical indicators are extremely bullish, and if the market doesn't go into "manic" bullish mode, it's going to be very difficult for current prices to be sustained. The inclination observed in spot prices since the beginning of April is only sustainable in environments of euphoria.
ETH/BTC 240 Minute Chart
The ETH/BTC pair is currently trading at the price level of 0.0346 after finding support yesterday in the lower trend of the parallel line structure that governs the development of this pair.
The bullish signal level is at 0.0352 (upper parallel trend line), but to get there the ETH/BTC has an additional obstacle at 0.035 (price congestion resistance). Above 0.0352 the bullish signal would spread across the board. The third resistance level is at 0.0366 (parallel upper trendline).
Below the current price of the ETH/BTC pair, the bearish signal price level has been tested in the Asian session at 0.0338 (lower bullish trend line). The second support level is at 0.0332 (price congestion support), while the third support level is at 0.0326 (price congestion support).
-636904846137250450.png)
The MACD on the 4-hour chart shows an extended bullish trend of terminal profile. This characteristic does not impose close drops, but a market with a significant degree of euphoria.
The DMI on the 4-hour chart confirms the potentially bullish situation and the bulls test the ADX from above and initiate a typical pattern of trend continuity. The bears, on the other hand, quickly get the message and again decrease their activity.
Do you want to know more about my technical setup?
BTC/USD 240 Minute Chart
The BTC/USD pair is currently trading at the $5.248 price level, maintaining the same price range as in the last two days. Since for the Crypto market to start a new uptrend, it is necessary for the ETH to do better than the BTC, we can expect some passivity from King Bitcoin. Otherwise, we will have to adjust stops in case of a possible bullish failure.
Above the current price, the first resistance level is at $5,500 (price congestion resistance), so the second resistance level for the BTC/USD pair is a solid confluence of price congestion resistances starting at $6,300, continuing at $6,400 and completing at $6,500. Above this price, the bullish process could accelerate exponentially.
Below the current price, the first support level at $5,100 (price congestion support and EMA50), then the second support level is at $4,600 (price congestion support and SMA100). The third level of support for the BTC/USD pair is at $4,200 (price congestion support and SMA200).
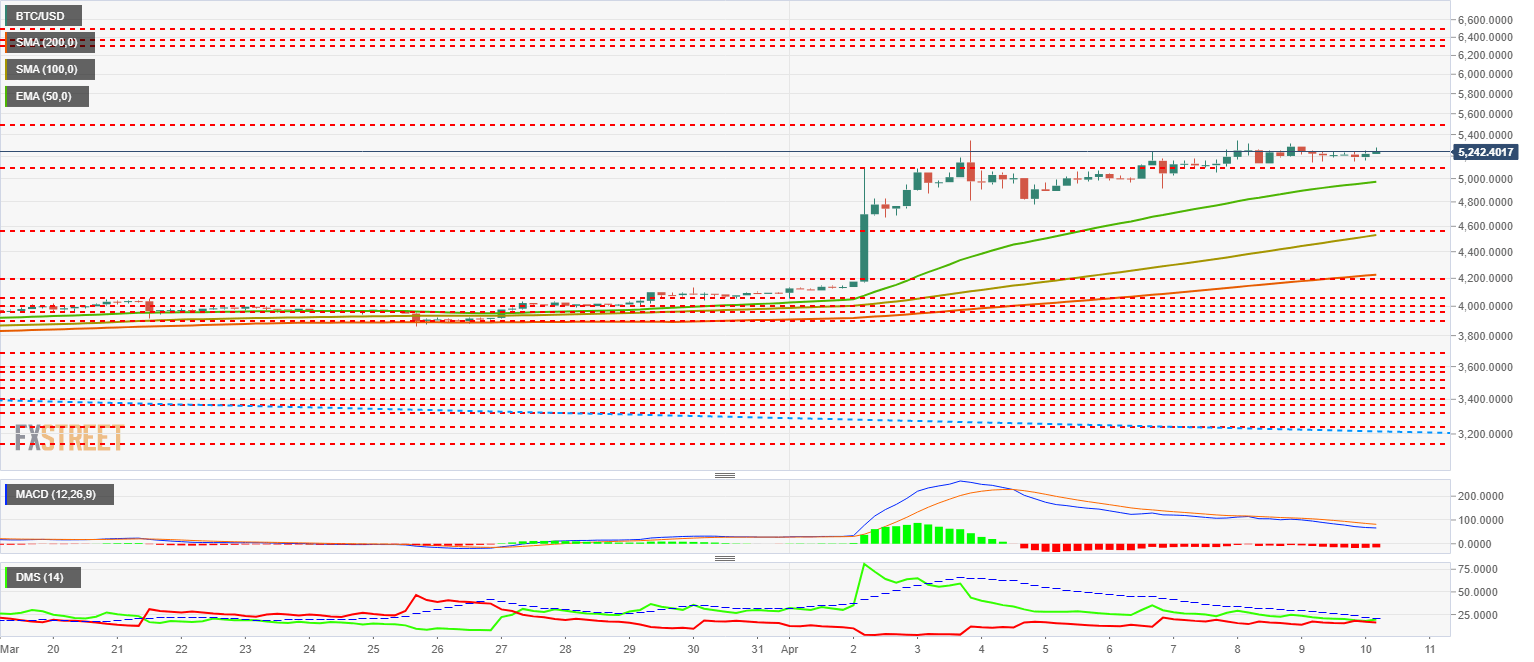
The MACD on the 4-hour chart shows how the averages continue to cross downward, albeit very horizontal and with hardly any distance between them. The pattern proposes a continuity of the lateral situation of the last hours.
The DMI in the 4-hour chart shows us how the tie between the two market forces has accentuated in the last hours. Both sides are configured to take the lead at the slightest insinuation. It shows a lack of definition.
ETH/USD 240 Minute Chart
The ETH/USD is currently trading at the $181.4 price level after regaining $180 support at the close of the Asian session.
Above the current price, the first resistance level is at $200 (price congestion resistance), then the second resistance level in the BTC/USD pair is at $225 (price congestion resistance). The third resistance level is at $235 (price congestion resistance).
Below the current price, the first support level is at the current level of $180 (price congestion support), then the second support level is at $170 (EMA50). The third level of support for the ETH/USD pair is at $150 (price congestion support and SMA100).
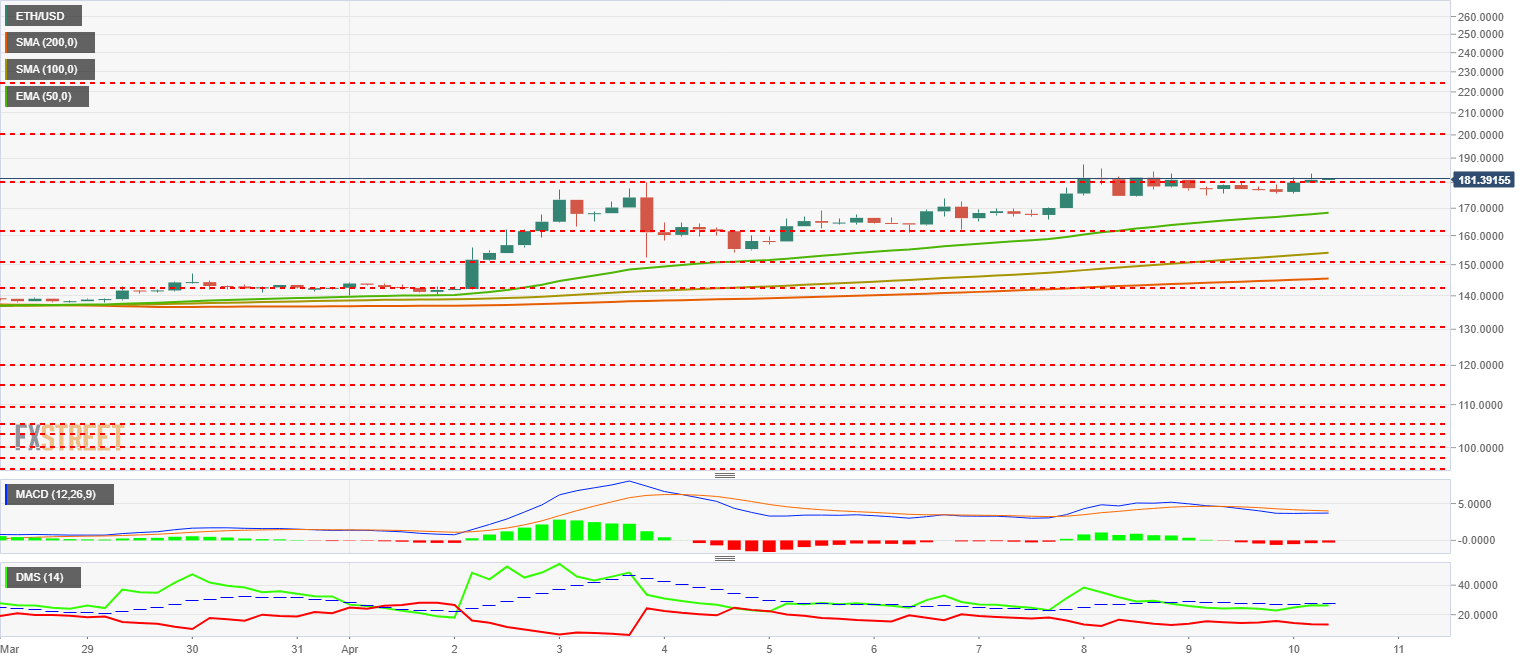
The MACD on the 4-hour chart is crossed wholly but down horizontal. The difference between lines is minimal. Any direction is possible but without losing sight of the fact that the indicator is in the bullish zone.
The DMI on the 4-hour chart shows bulls dominating the market but already below the ADX line, which weakens the bullish position. The bears are not interested in being protagonists and remain at low levels.
XRP/USD 240 Minute Chart
The XRP/USD is trading at the $0.356 price level after finding support in the EMA throughout the Asian session. Of the three assets analyzed, the XRP is the one with the healthiest bullish structure. A very well defined bullish flag.
Above the current price, the first resistance level is $0.367 (price congestion resistance), then the second resistance level is $0.39 (price congestion resistance). The third resistance level for the XRP/USD pair is $0.44 (price congestion resistance).
Below the current price, the first support level is $0.356 (EMA50), then the second support level is $0.335 (price congestion support and SMA100). The third level of support for the XRP/USD pair is $0.329 (price congestion support).
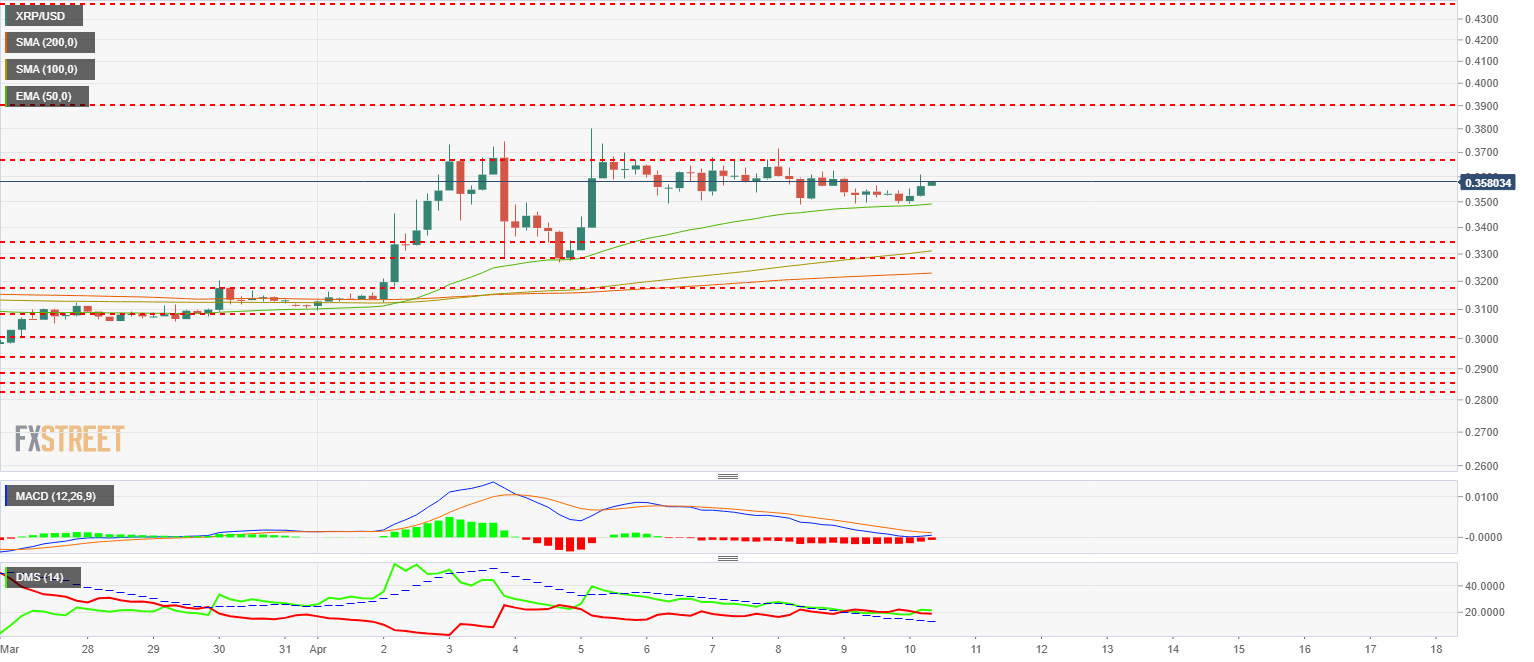
The MACD on the 4-hour chart shows a potential bullish cross profile even though the pattern advises not to take the first attempt for granted. The passage of hours can make the XRP the protagonist of the week.
The DMI on the 4-hour chart shows how bulls have a slight advantage over bears, but it is neither enough nor definitive. The ADX reaches shallow levels, which by a simple opposite reaction, gives as possible a sudden increase of the trend strength.
Get 24/7 Crypto updates in our social media channels: Give us a follow at @FXSCrypto and our FXStreet Crypto Trading Telegram channel
Author

Tomas Salles
FXStreet
Tomàs Sallés was born in Barcelona in 1972, he is a certified technical analyst after having completing specialized courses in Spain and Switzerland. He expanded his technical training following the guidance of great experts on the financial markets.


