Top 3 Price Prediction Bitcoin, Ripple, Ethereum: Why the Crypto market goes up and will continue to do so
- Yesterday, the ETH/BTC crypto cross capitulated.
- The key conditions for moving into bullish mode are now met.
- What has been raised so far has only been an aperitif of what is to come.

We are at the second day of a market in rabid green and reaching levels not seen in many months. The session begins in Europe with logical backward movements that can lead to consolidations although the bullish inertia should continue to push prices up even within a few hours.
Today I am going to focus on trying to explain the technical slide of the movements and more interesting for our readers, what we can expect to happen next.
What we have seen these last two days has been the capitulation of Ethereum against Bitcoin. Since February 24th, when Ethereum reached its best level against Bitcoin, the King has been doing relatively better than the eternal aspirant. On Tuesday, thanks to the substantial rise of BTC against ETH, the pair reached the level (point A) where the lower bullish parallel line of multiple parallel structures that govern the movement of this pair passed. At that point, it concludes the bearish phase of ETH versus BTC, and technically the market renews the pattern that explains that for the Crypto market to enter into bullish phase, Ethereum must do better than the Bitcoin.
ETH/BTC 240 Minute Chart
After reaching point A, the pair turned violently upwards, crossed unopposed the two upper parallels and reached the third one at 0.0349 (point B). After the BTC /USD rise, it has tested the support of the lower parallel at 0.0333 (point C).
ETH/BTC is currently trading at 0.0338. Above the current price, the first resistance level is 0.035 (parallel trendline and price congestion resistance). The second resistance level is at 0.0362 (upper parallel trend line). Above this second resistance level, the third resistance level is at 0.0381 (price congestion resistance).
Below the current price, the first support level is at today's low point of 0.0333 (price congestion support and lower parallel trendline). The second support level is at 0.0322 (parallel trendline), and the third support level is at 0.0316 (price congestion support).
-636898799824294114.png)
The MACD on the 4-hour chart shows how after yesterday's drop, the lines have been correctly configured for a bullish cross. Right now the cross is in development, which causes a rejection effect that is slowing the market.
The DMI on the 4-hour chart shows us how the bears that dominated the market yesterday are about to give up leadership to the bulls today. At this point, the new bullish section of the cryptocurrencies market could be made official.
Do you want to know more about my technical setup?
BTC/USD 240 Minute Chart
The BTC/USD pair is currently trading at the $4.968 price level after failing twice at $5.089, revealing the importance of this area and turning it into a price congestion resistance.
The configuration of moving averages is very bullish, as is the MACD or DMI. We never know for sure how far a move can go, but the current uptrend has the strength for a while.
Above the current price, the first resistance level is $5,089 (price congestion resistance). The second resistance level is at $5,500 (price congestion resistance). The third resistance level is a solid confluence of $6,300, $6,350 and $6,500 (price congestion resistance).
Below the current price, the first support level is at $4,600 (price congestion support). The second level of support is at $4,200 (price congestion support and EMA50). The third level of support is a solid confluence starting at $4,050 (price congestion support and SMA100), continuing at $4,000 (price congestion support) and ending at $3,900 (price congestion support).
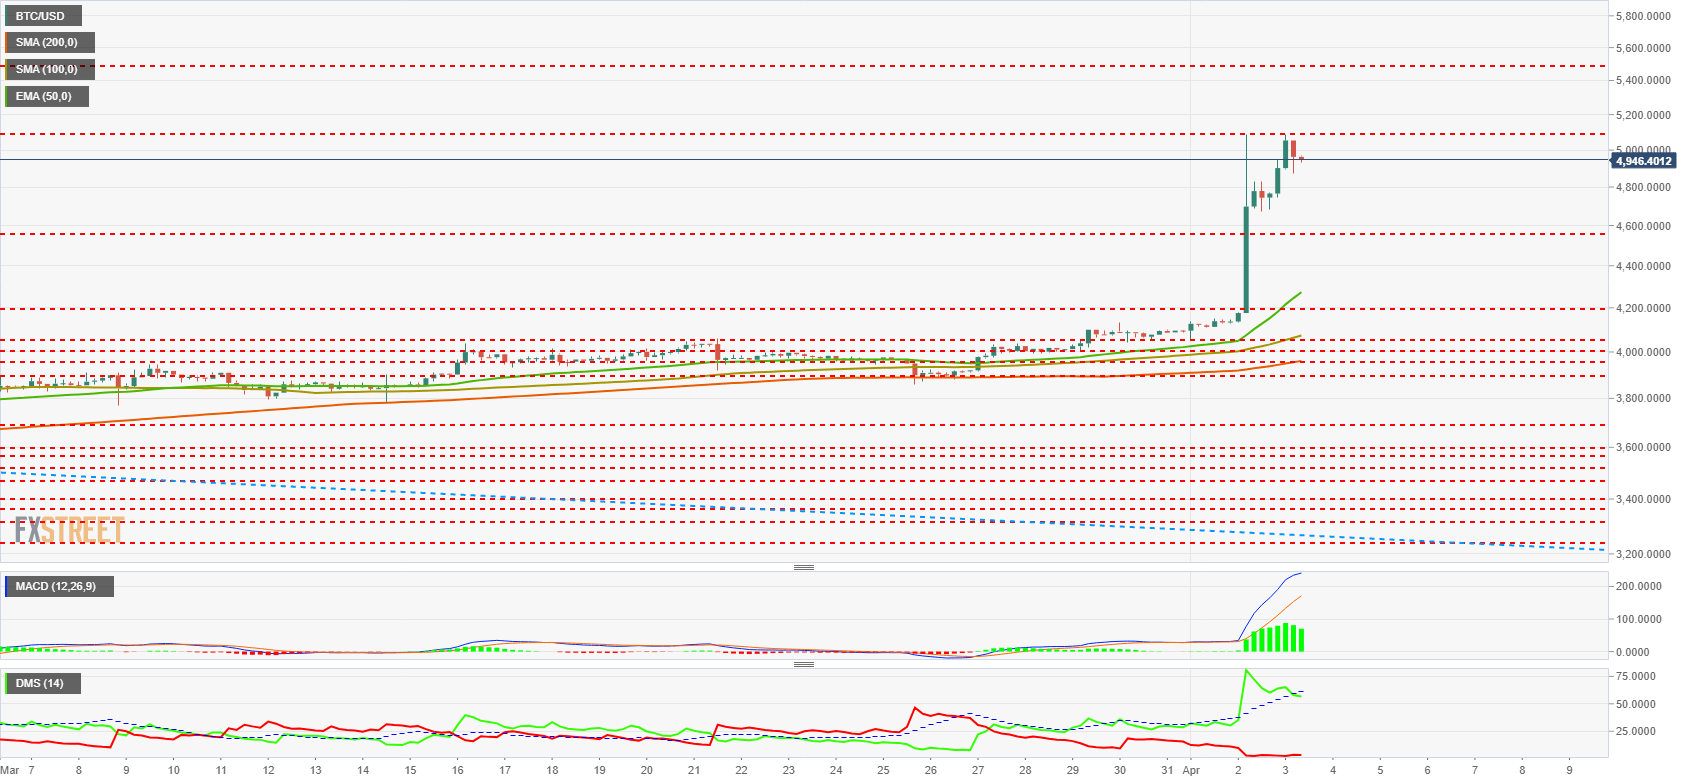
The MACD on the 4-hour chart shows an almost vertical profile that must be relaxed at some point to avoid future problems. It shows that the upward movement has been consistent and very energetic.
The DMI on the 4-hour chart tells the same story as the MACD. A massive amount of money comes in while the bears seem to be hibernating just as winter is coming to an end.
ETH/USD 240 Minute Chart
The ETH/USD pair is currently trading at the price level of $166, setting an intraday high at $177. Ethereum is doing very well in taking the lead.
Above the current price, the first resistance level is at $180 (price congestion resistance). The second resistance level is at $200 (price congestion resistance), so the third resistance level is at $215 (price congestion resistance).
Below the current price, the first support level is at the price level of $162 (price congestion support). The second support level is at $150 (price congestion support), while the third support level is a solid confluence in the $140 zone (EMA50, price congestion support, SMA100, and SMA200).
-636898801554338294.png)
The MACD on the 4-hour chart shows some depletion but retains a strong uptrend and wide line spacing. A structure that would allow continuing rising without problems despite the loss of the initial impulse.
The DMI on the 4-hour chart shows the same bullish strength. The bulls go to very high levels while the bears go to minimums of many months.
XRP/USD 240 Minute Chart
The XRP/USD is currently trading at the $0.349 price level after leaving the intraday high at $0.373.
Above the current price, the first resistance level is at the price level of $0.368 (price congestion resistance). So, the second resistance level for XRP/USD is $0.39 (price congestion resistance), and the third resistance level is $0.437.
Below the current price, the first support level is $0.334 (price congestion support), then the second support level is $0.328 (price congestion support). The third level of support for the XRP/USD pair is an important confluence at $0.317 (price congestion support, EMA50, SMA200, and SMA100).
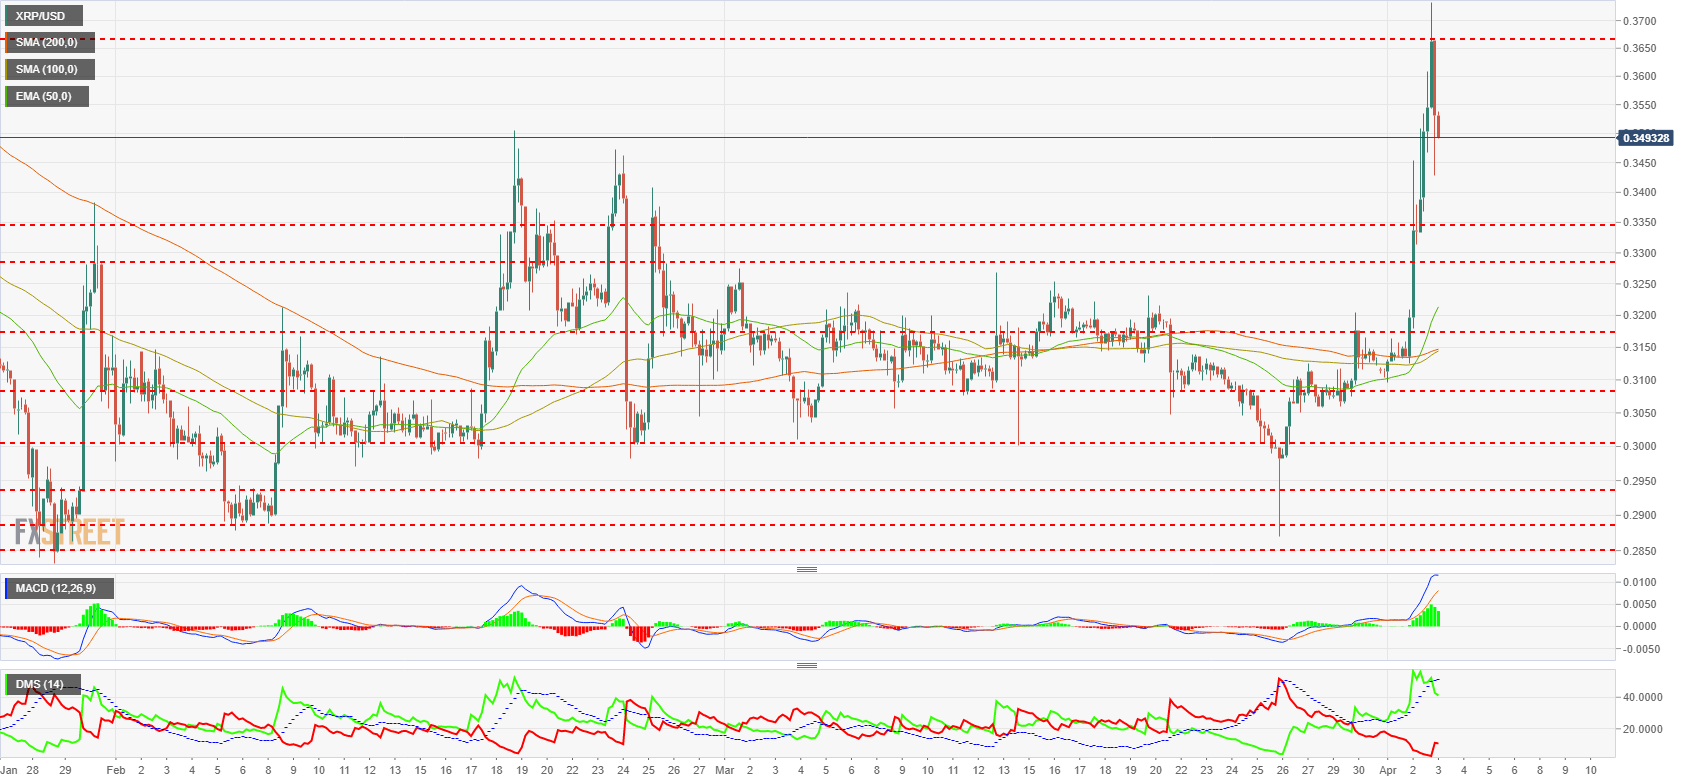
The MACD on the 4-hour chart shows a very bullish profile with some exhaustion. The bullish momentum is so aggressive that it can continue to rise despite the flattening of the lines.
The DMI on the 4-hour chart shows a slightly more advanced development than we have seen on the ETH/USD pair. Here the bulls reached maximum levels and now they are placed below the ADX line, which takes away the bullish potential. On the other hand, the bears, improve some and get out of minimum levels not seen since 2018.
Get 24/7 Crypto updates in our social media channels: Give us a follow at @FXSCrypto and our FXStreet Crypto Trading Telegram channel
Author

Tomas Salles
FXStreet
Tomàs Sallés was born in Barcelona in 1972, he is a certified technical analyst after having completing specialized courses in Spain and Switzerland. He expanded his technical training following the guidance of great experts on the financial markets.


