- Cryptocurrencies woke up from there sleep at low levels and bounced.
- All three top digital coins have significant support lines and upside potential.
- Here are the levels to watch according to the Confluence Detector, our proprietary tool
After a long period of slumber at low levels, cryptocurrencies are finally waking up and smelling the coffee. Are they about to enjoy a Santa Rally? There seems to be no significant trigger for the rise.
Did whales begin accumulating after the big dump? While some coins are still worth half of their value before November 14th, the awakening is a positive development.
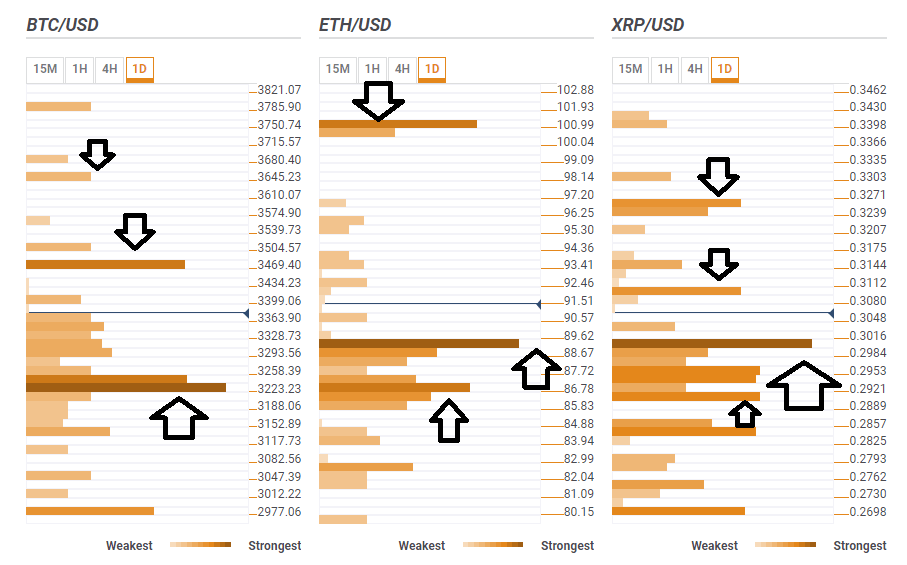
BTC/USD above support, next hurdle $3,469
Bitcoin bounced above $3,000 and has overcome the strong resistance line at $3,223 which is a dense cluster including the Simple Moving Average 50-1h, the SMA 200-15 minutes, the Bollinger Band 4h-Middle, the Fibonacci 61.8% one-day, the SMA 10-4h, the SMA 5-4h, the Bollinger Band 1h-Middle, and more.
The next support line is at $3,133 where we see the confluence of the Fibonacci 161.8% one-day and the Pivot Point one-day Support 2.
The upside target is $3,469 which is the meeting point of the previous month's low and the Fibonacci 61.8% one-week.
The next upside target is $3,645 which was last week's high and also the BB one-day Middle.
ETH/USD eyes $101
Vitalik Buterin's digital currency has also overcome a considerable level: $89.20 is the convergence of the SMA 10-one-day and the Fibonacci 38.2% one-week.
It is backed up by $86.78 which is where the Fibonacci 23.6% one-week, the SMA 10-4h, the BB 1h-Middle, and the SMA 5-4h converge.
Resistance for ETH/USD awaits at $101 which is the confluence of the BB one-day Middle, the previous month's low, and last week's high. It is the next upside target for Ether.
XRP/USD supported at exactly $0.30
Ripple made a nice move higher as well and topped the round number of $0.30. It proved to be a substantial achievement as the round number sees a concentration of levels: the SMA 50-4h, the SMA 10-one-day, the Fibonacci 38.2% one-week, and the BB 1h-Upper.
Further down, there are quite a few cushions, with $0.2911 standing out as the meeting point of the SMA 50-1h, the SMA 200-15m, the Fibonacci 61.8% one-day, and the BB 4h-Middle.
Some resistance awaits XRP/USD at $0.3096 where we see the cluster including the PP one-day R3, the Fibonacci 61.8% one-week, and the previous 15-minute high.
The upside target is $0.3250 which is last week's high and last month's low.
Information on these pages contains forward-looking statements that involve risks and uncertainties. Markets and instruments profiled on this page are for informational purposes only and should not in any way come across as a recommendation to buy or sell in these assets. You should do your own thorough research before making any investment decisions. FXStreet does not in any way guarantee that this information is free from mistakes, errors, or material misstatements. It also does not guarantee that this information is of a timely nature. Investing in Open Markets involves a great deal of risk, including the loss of all or a portion of your investment, as well as emotional distress. All risks, losses and costs associated with investing, including total loss of principal, are your responsibility. The views and opinions expressed in this article are those of the authors and do not necessarily reflect the official policy or position of FXStreet nor its advertisers. The author will not be held responsible for information that is found at the end of links posted on this page.
If not otherwise explicitly mentioned in the body of the article, at the time of writing, the author has no position in any stock mentioned in this article and no business relationship with any company mentioned. The author has not received compensation for writing this article, other than from FXStreet.
FXStreet and the author do not provide personalized recommendations. The author makes no representations as to the accuracy, completeness, or suitability of this information. FXStreet and the author will not be liable for any errors, omissions or any losses, injuries or damages arising from this information and its display or use. Errors and omissions excepted.
The author and FXStreet are not registered investment advisors and nothing in this article is intended to be investment advice.
Recommended Content
Editors’ Picks
Ripple's move above this key level could trigger nearly 50% rally for XRP
Ripple has overcome a critical resistance level and flipped into a support floor on the weekly time frame. This development happened while XRP tightly consolidated for roughly 250 days. Investors can expect XRP to kickstart a massive rally.
Optimism price outlook with nearly $90 million worth of OP tokens flooding markets on Friday
Optimism volatility has shrunk in the ours leading to the network’s cliff unlock. It joins the likes of dYdX and Sui, which have similar events on their calendars. As token unlocks are often considered bearish catalysts, investors should brace for a reaction after the event.
Top 3 Price Prediction Bitcoin, Ethereum, Ripple: Retail watches from the sidelines with a bias for shorts
Bitcoin could clear $73,777 peak as BTC bulls resurface. Ethereum might fall 10% before next leg up as ETH RSI teases with sell signal. XRP could lose $0.6000 threshold as Ripple bulls fail to show up.
Jito price could hit $6 as JTO coils up inside this bullish pattern
Jito price action shows a potential cup and handle formation. Based on theoretical measurement rules, a successful breakout could yield a 56% rally to $6.0. A breakdown of the $3.86 support level would create a lower low for JTO and invalidate the bullish thesis.
Bitcoin: BTC may have recovered, but is it out of the woods?
Bitcoin’s (BTC) upward momentum has shown a significant decline for the past two weeks or so. This development led to a bearish signal on the weekly and an uncertain outlook on the monthly.