Top 3 Price Prediction Bitcoin, Ripple, Ethereum: A 30% pullback is a great chance to collect Bitcoins, BTC/USD targets $5,500
- ETH/BTC leads the way in the event of falls.
- Neutral strategies are also possible for the more conservative.
- This game is the favorite of the applicants for "whale."

Yesterday was a day of little movement in the Crypto market, as predictions had indicated that that would happen if the SEC postponed the decision on the ETFs.
At least, that's what you see at first glance. My job as an analyst is to look beyond, pay attention to details, and try scoring "extra points" to give us some advantage.
At first glance, we see King Bitcoin holding the position in front of the wall, which is the long term bearish upper parallel trend line. Ethereum is in a similar situation to the "gap" between $260 and $280. XRP shows a less aggressive structure and is content to continue in its consolidation scheme.
Looking a little closer, we see that the ETH/BTC cross has improved considerably, and it seems that the consolidation process has already finished after reaching a high of 0.035 last week. This relative improvement opens the door to a possible scenario in which, incorporating the multiple warnings on a pullback of -+30 % in BTC/USD, proposes to accumulate Bitcoins looking for an instrument that will do better than the King.
There are many candidates for this role, whose potential increases with the risk we want to assume. My preference is to use Ethereum against Bitcoin; both are assets with high volume, only manipulable by the "whales" and that guarantee to faithfully follow the general behavior of the market, avoiding movements that would jeopardize the strategy.
ETH/BTC 4 Hours Chart
ETH/BTC is currently trading at 0.0322, after trying late yesterday to break the upper parallel bullish trend line.
Above the current price, the first resistance level is around 0.033 (upper parallel trend line and price congestion resistance), then the second resistance level is 0.0345 (top parallel trend line). The third resistance level for the ETH/BTC pair is at 0.035 (price congestion resistance).
Below the current price, the first support level is at 0.0316 (price congestion support), then the second support level is at 0.031 (EMA50 and lower parallel bullish trend line). The third support level for the ETH/BTC pair is at 0.03 (SMA200 and price congestion support).
-636941143664152626.png)
The MACD on the four-hour chart shows an emerging bullish cross. The cross is unconfirmed, and being clear, it is likely not a clean cut. The scenario is so clearly to the upside that bears may think it is an excellent place to hunt bulls.
The DMI on the four-hour chart shows bulls dominating the market without stridency. Buyers stay above the ADX line, and therefore the bullish mode remains intact. Bears continue to decline.
BTC/USD Daily Chart
BTC/USD is currently trading at $7,942, maintaining the siege of the long term upper parallel bearish trend line. The overall aspect is not very promising in terms of overcoming the technical barrier.
Above the current price, the first resistance level is precisely the one discussed in the previous paragraph, which is now at $8,220. The second resistance level is at $8,400 (price congestion resistance), so the third resistance level for BTC/USD is at $8,750 (price congestion resistance).
Below the current price, the first support level is at $7,871 (price congestion support), then the second one is $7,718 (price congestion support). The third level of support for BTC/USD pair is at $7,600 (price congestion support).
If the famous 30% pullback occurs, the target is at the channel's lower parallel bearish trend line level of approximately $5,500.
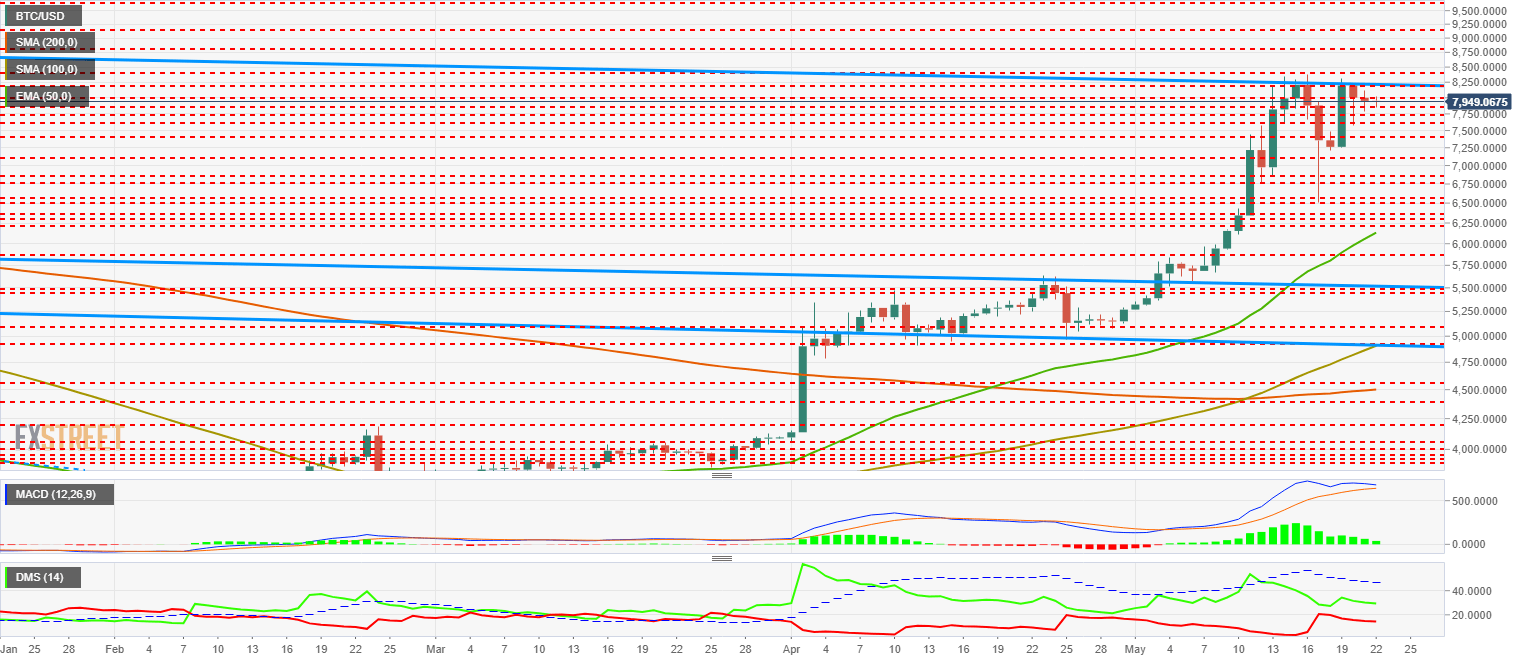
The MACD on the daily chart shows an incipient bearish cross profile. There is no doubt that BTC/USD is going to see price declines in the next few days, although uncertainty remains about the strength and intensity with which this occurs.
The DMI on the daily chart shows bulls dominating the market, still retaining a good advantage over bears. The selling side is bright but its time is yet to come and remains just below the 20 lines of the indicator. A change of scenery can occur at any time.
ETH/USD Daily Chart
ETH/USD is currently trading at $257.98, rising during the day and maintaining that better performance against BTC.
Above the current price, the first resistance level is $260 (price congestion resistance), then the second one $280 (price congestion resistance). The third resistance level is at $305 (price congestion resistance).
Below the current price, the first support level is at $250 (price congestion support), then the second support level is at $235 (price congestion support). The third level of support is at $225 (price congestion support).
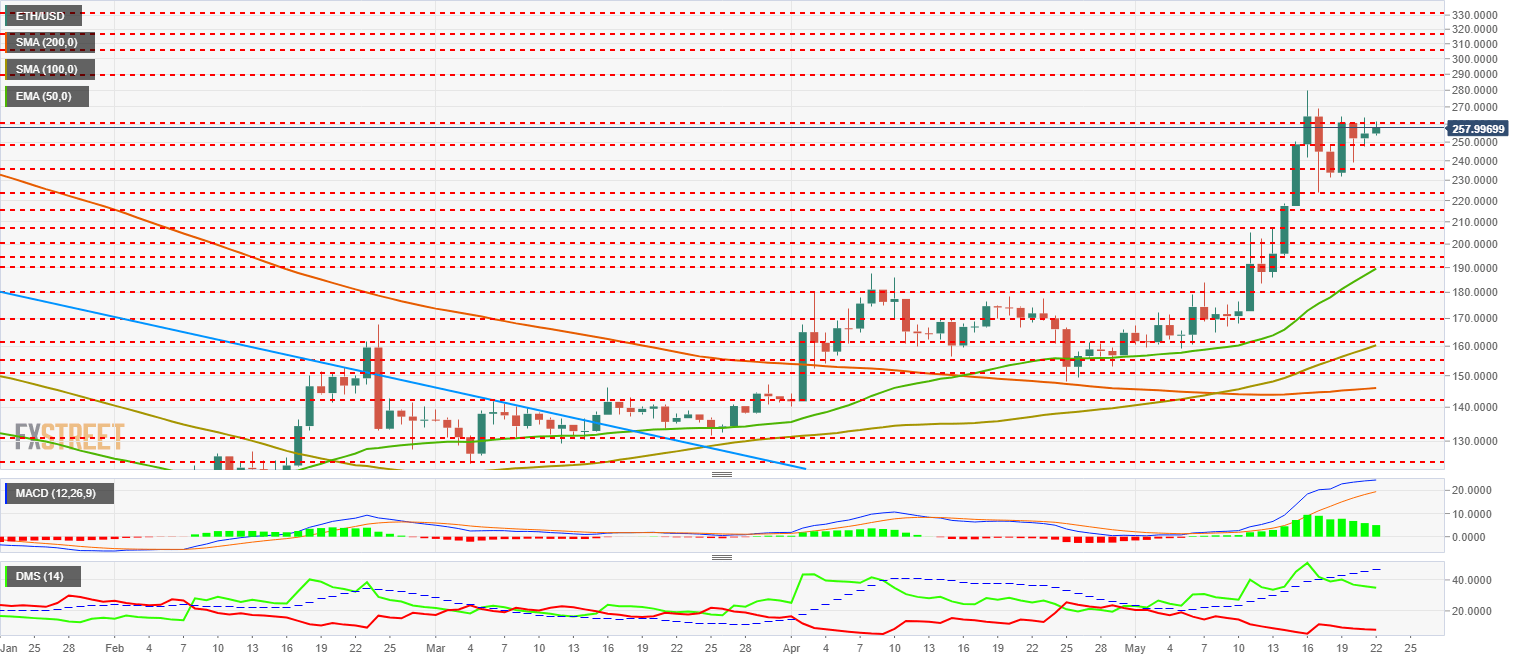
The MACD on the daily chart retains a good bullish profile, while the separation between them is also vast. Its setup keeps quite a lot of bullish potential.
The DMI in the daily chart shows how bulls rule the market with many advantages over bears. On the selling side, confidence is weak, marking low levels. This is a very different situation to the one we just saw in Bitcoin.
XRP/USD Daily Chart
XRP/USD is currently trading at $0.401 and is already in the late phase of consolidation.
Above the current price, the first resistance level is $0.413 (price congestion resistance), then the second resistance level is $0.43 (price congestion resistance). The third resistance level for XRP/USD is $0.44 (double price congestion resistance).
Below the current price, the first support level is $0.39 (price congestion support), then the second one is $0.37 (price congestion support). The third level of support for the XRP/USD pair is at $0.345 (EMA50, SMA100, and price congestion support).
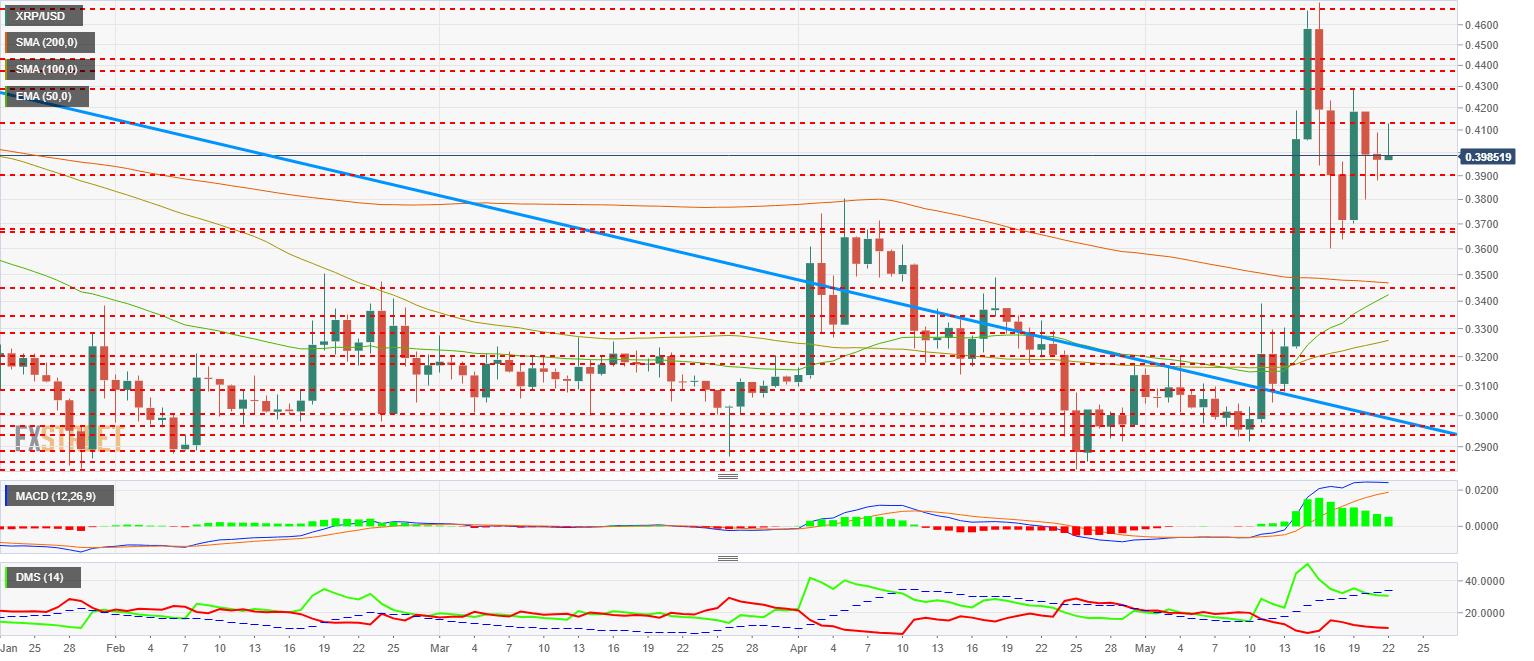
The MACD on the daily chart shows a slightly more advanced profile than that seen on Ethereum. It retains a good opening between lines, but the slope has almost disappeared, entering a horizontal situation.
The DMI on the daily chart shows how bulls slip below the ADX line, which initiates a pattern of price falls. The bears, on the other hand, do not trust much in this weakness and stay at minimum levels.
Get 24/7 Crypto updates in our social media channels: Give us a follow at @FXSCrypto and our FXStreet Crypto Trading Telegram channel
Author

Tomas Salles
FXStreet
Tomàs Sallés was born in Barcelona in 1972, he is a certified technical analyst after having completing specialized courses in Spain and Switzerland. He expanded his technical training following the guidance of great experts on the financial markets.


