Top 3 Price Prediction Bitcoin, Ethereum, Ripple: Pointing beyond the Moon
- Signs of a bull market not seen since 2017 are piling up.
- Altcoins capitalize on risk sentiment and rise strongly against Bitcoin.

XRP remains on the sidelines, although it could join the bullish run.
The crypto market is starting to remind us of times gone by, with dazzling rises across the crypto board that draw the public's attention.
The sensations are very positive from a technical point of view. There are several signs that we may be facing the expected bullish market after the Bitcoin halving.
The weekend leaves us with the great news of the new awakening of the Altcoin segment after several weeks of doubts about who was leading the competition for market share.
The Ethereum's value chart against the major FX was left on Friday at the gates of a major breakout, being Saturday when the bullish breakout that has revolutionized the entire Crypto market took place.
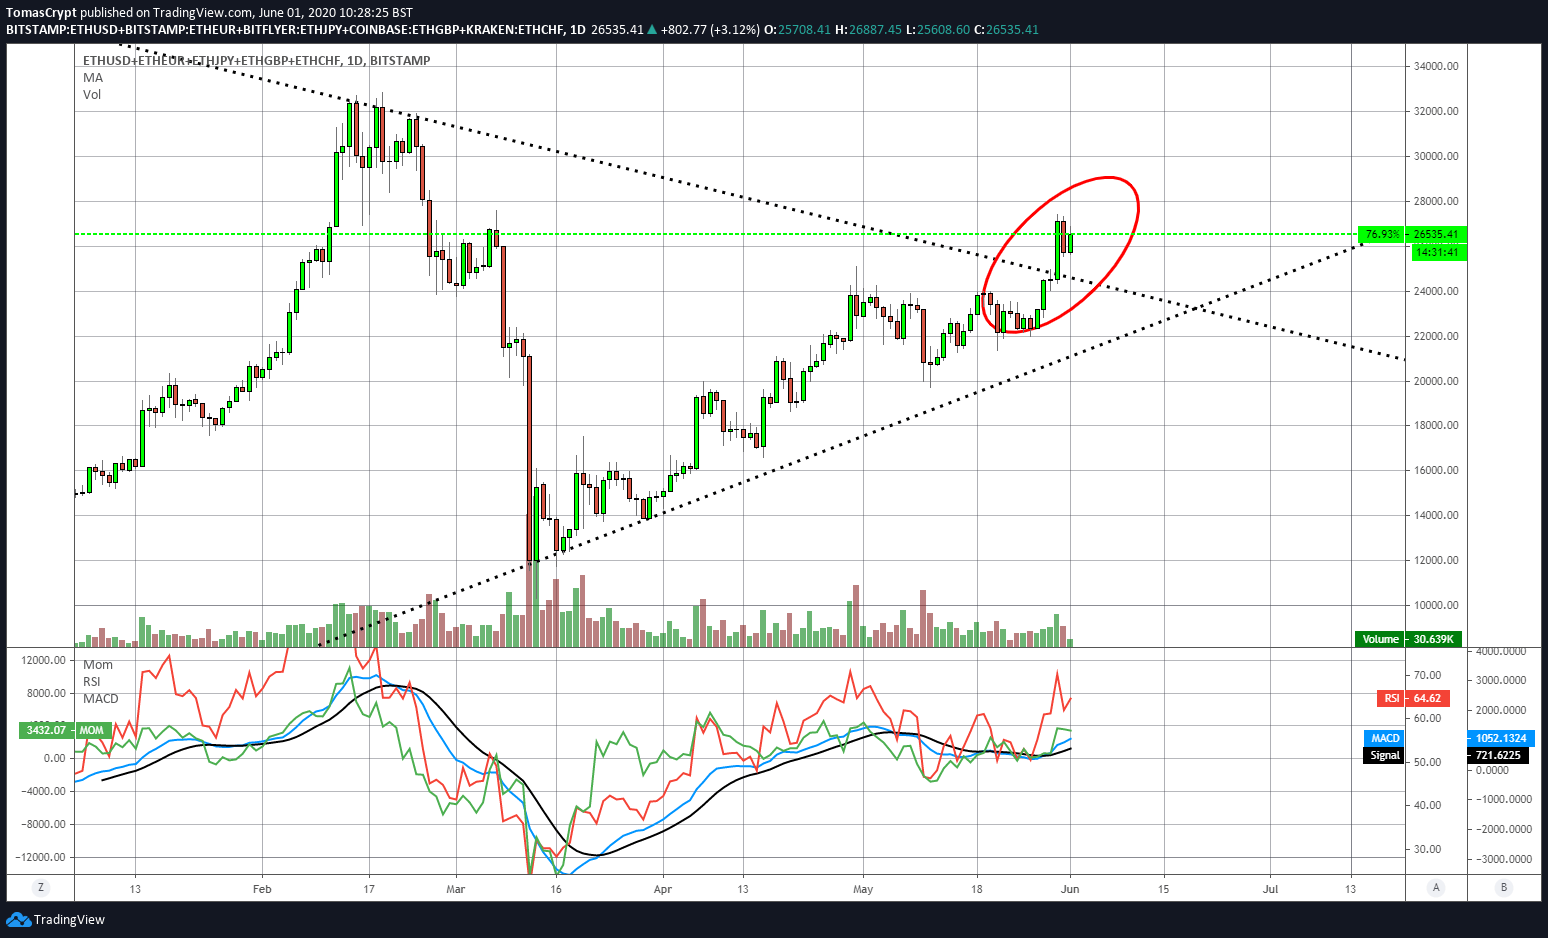
The Bitcoin has continued to lose levels of dominance over the weekend against the strength of the Altcoin segment. Now Bitcoin finds support at the 66% market share level.
Below the 65.5% dominance level, Bitcoin would accelerate its decline against Ethereum and other Altcoins such as Cardano (ADA), which in the last hours achieved 35% increases in value against BTC.
-637266007870142961.png)
The market sentiment level starts the week at the 50 levels and improves more than 20% in a few hours.
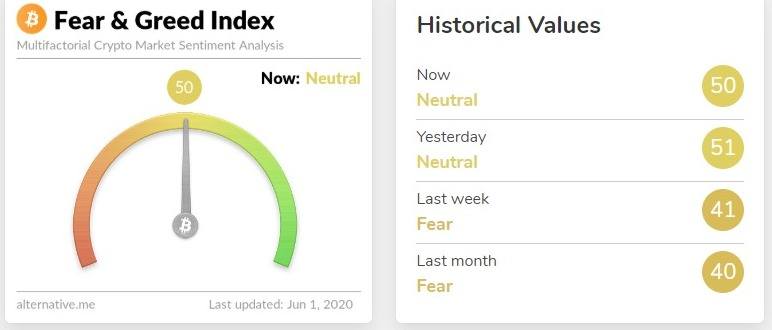
Source: alternative.me
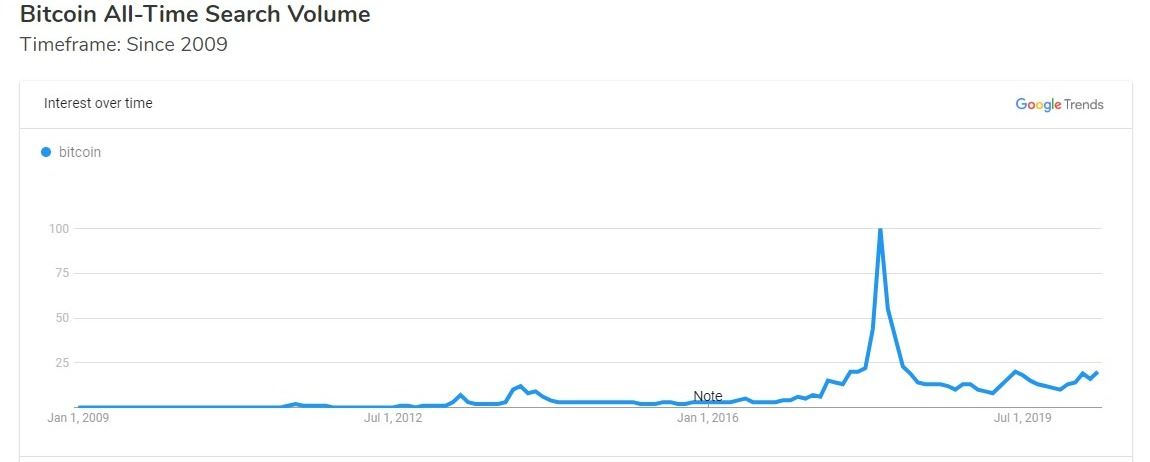
Another data that gives us indications that this time the crypto rocket has started the trip to the Moon comes from Internet searches related to the term Bitcoin.
For the first time since July 2017, we can observe the formation of a consistent upward trend.
The market indicators give support to propose a bull run in the next months with the potential to leave behind the historical highs and possibly change the Moon for another target beyond the Solar System.
ETH/BTC Daily Chart
The ETH/BTC pair is currently trading at the 0.0249 level and works to stay in the upper half of its range over the past few hours. The 50-day exponential moving average is accelerating its upward trajectory and could reinforce the current trend by surpassing the 100-day simple moving average.
Above the current price, the first resistance level is at 0.0258, then the second at 0.0268 and the third one at 0.0275.
Below the current price, the first support level is at 0.0235, then the second at 0.023 and the third one at 0.022.
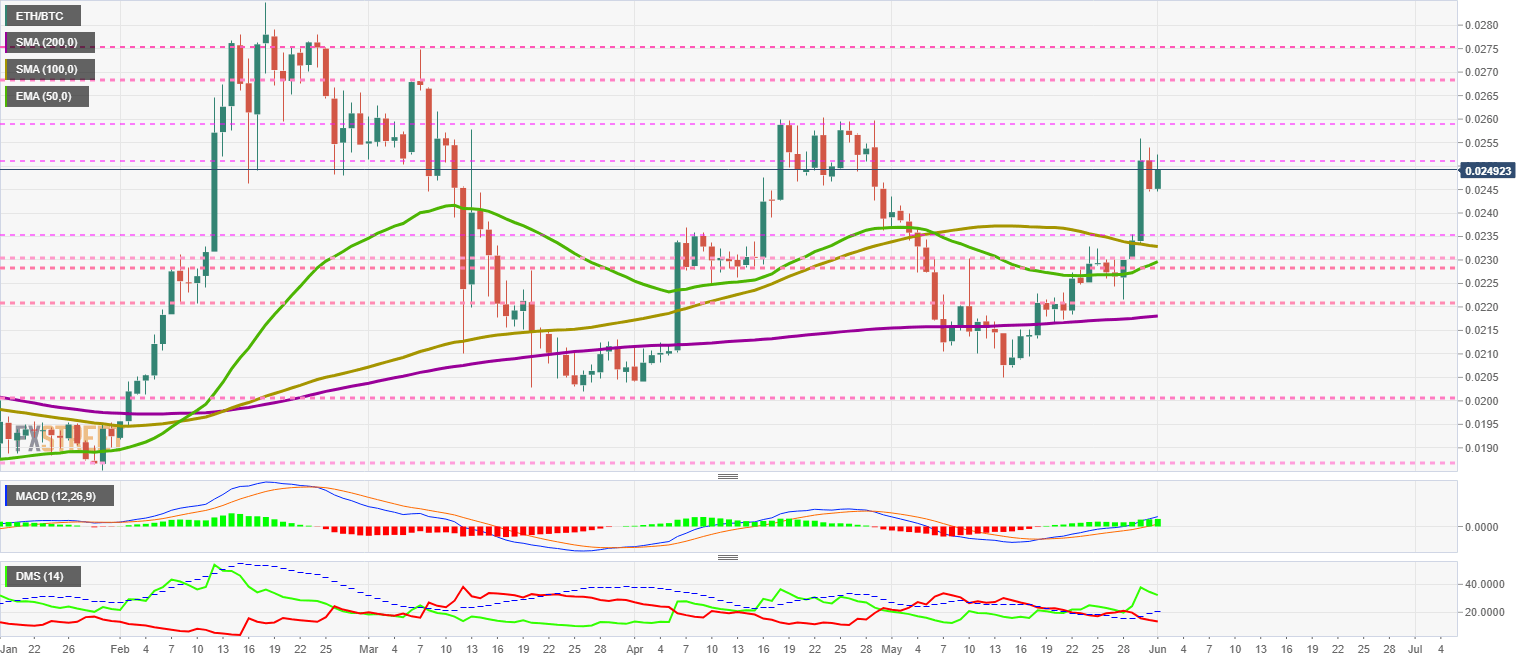
The MACD on the daily chart is already in the bullish zone of the indicator and maintains both the upward slope and the averages line separation. The current structure is favorable for the continued upward movement of the ETH/BTC
The DMI on the daily chart shows bulls dominating the ETH/BTC pair, while bears are giving up and moving below the ADX line.
BTC/USD Daily Chart
The BTC/USD pair is currently trading at $9550 and is giving way to the Altcoins. The Bitcoin is just a few dollars away from triggering a new bullish trend that would easily take it above the $11250 price level.
Above the current price, the first resistance level is at $9750, then the second at $10650 and the third one at $11250.
Below the current price, the first support level is at $9200, then the second at $8800 and the third one at $8400.
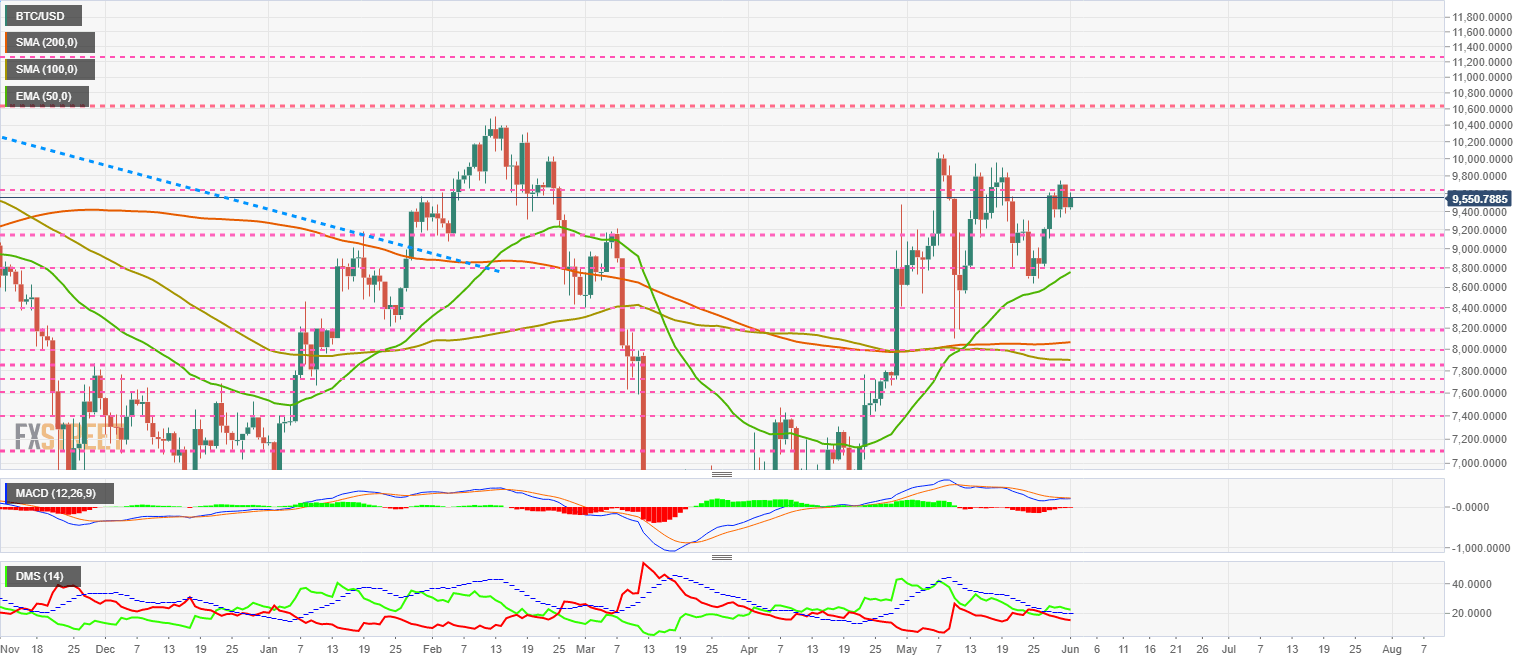
The MACD on the daily chart shows a dual structure that allows for scenarios in both market directions. Market momentum is shifting the balance towards a probable upward movement.
The DMI on the daily chart shows bulls leading the market while bears are rapidly losing strength.
ETH/USD Daily Chart
The ETH/USD is currently trading at the price level of $237.9 after failing to break the price congestion resistance level at $250.
Above the current price, the first resistance level is at $250, then the second at $260 and the third one at $290.
Below the current price, the first support level is at $235, then the second at $228 and the third one at $225.
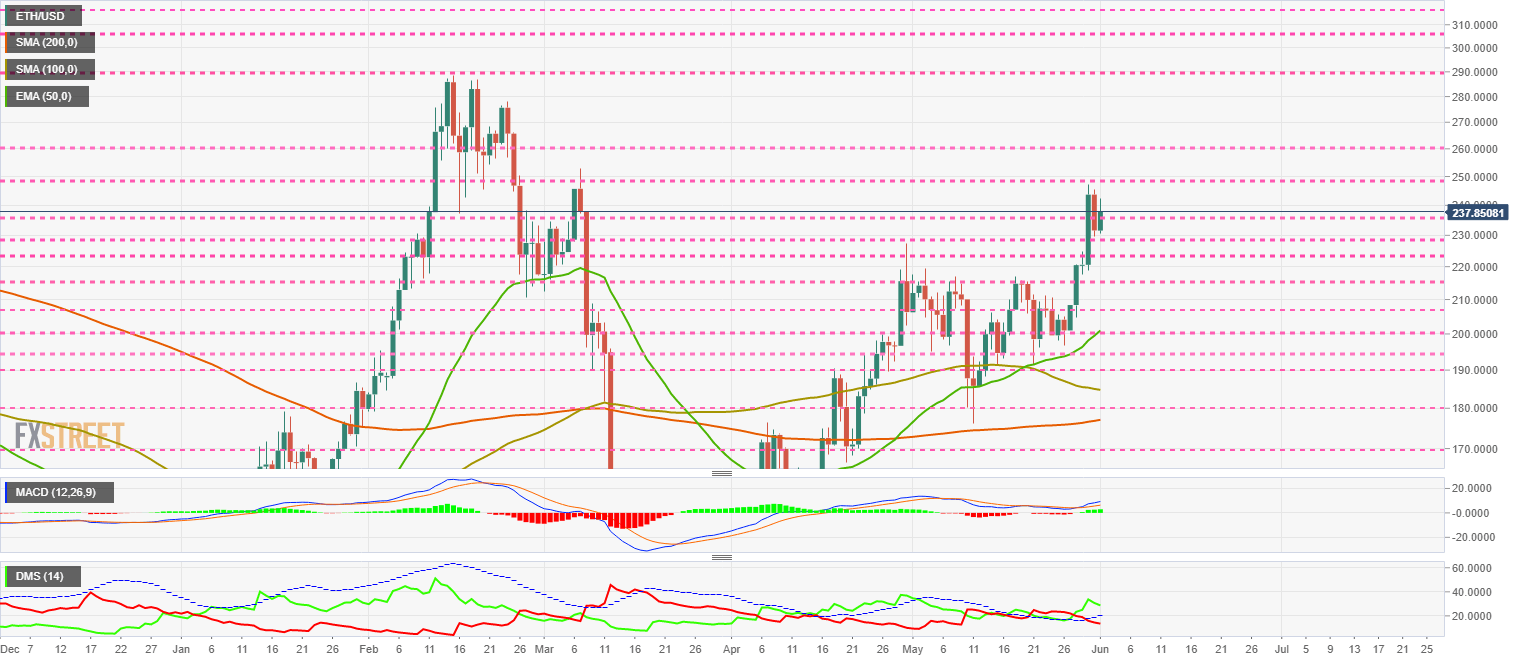
The MACD on the daily chart is once again sloping higher as the line separation increases indicating continuity in the short term.
The DMI on the daily chart shows the bulls losing some strength after the failed attempt at the $250 level. The bears are consistently losing power and confirm the bullish momentum in the ETH/USD.
XRP/USD Daily Chart
The XRP/USD is currently trading at a price level of $0.204 and as usual remains outside of the dominant market trend.
Above the current price, the first resistance level is at $0.217, then the second at $0.236 and the third one at $0.253.
Below the current price, the first support level is at $0.20, then the second at $0.19 and the third one at $0.18.
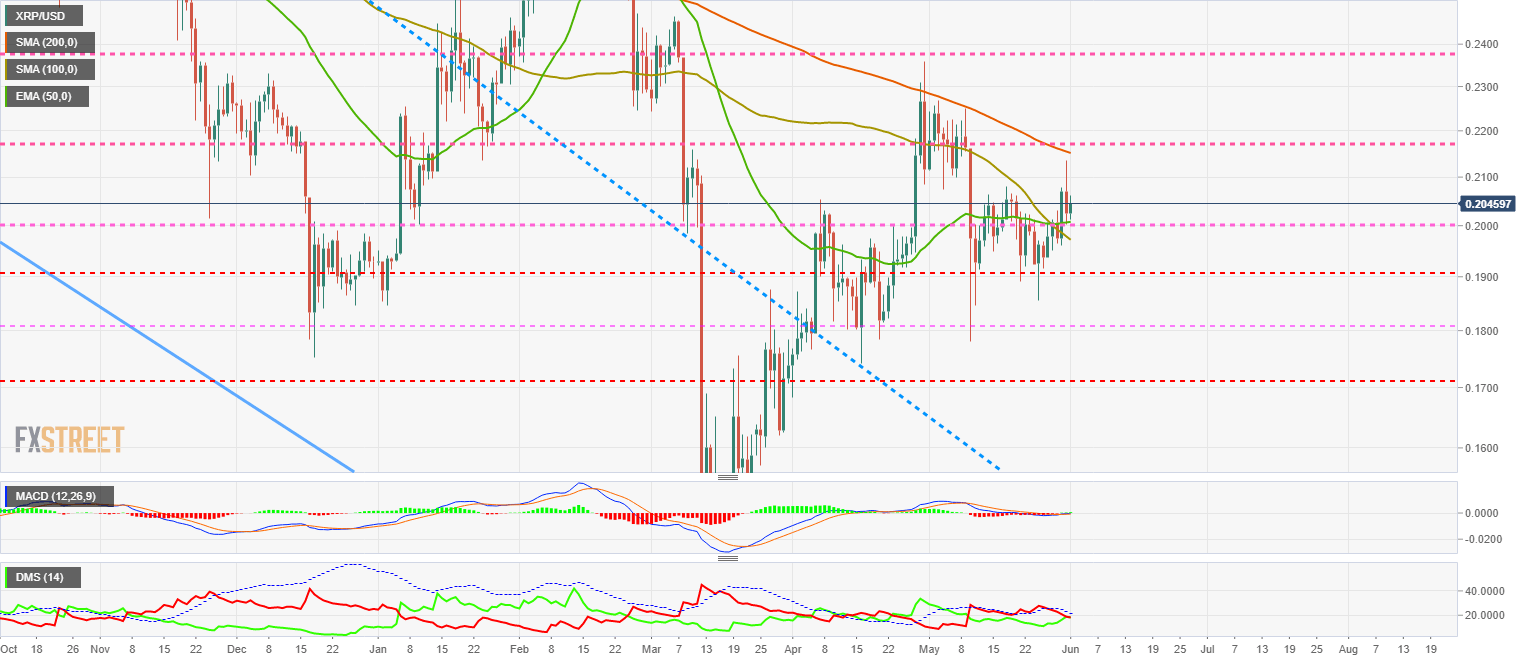
The MACD on the daily chart shows a flat profile resting on the 0 levels of the indicator. The current structure shows signs of a possible upward movement in the next few hours.
The DMI on the daily chart is at a critical moment as the bulls, and the bears fight to lead the XRP/USD pair. The buying side has more support due to the general momentum of the Crypto market.
Author

Tomas Salles
FXStreet
Tomàs Sallés was born in Barcelona in 1972, he is a certified technical analyst after having completing specialized courses in Spain and Switzerland. He expanded his technical training following the guidance of great experts on the financial markets.


