Top 3 Price Prediction Bitcoin, Ethereum, Ripple: Market saved by the Bell, round 1
- Last-minute rises in Bitcoin save the market from a complicated short-term scenario.
- Ethereum gives the initiative to Bitcoin in the quest for the long-awaited trip to the moon.
- Ripple could extend his lethargy beyond the summer.

When everything pointed out that the sales that had appeared in the last hours would damage the structure of the market, Bitcoin turned around and saved the situation.
The price recovered strongly at the end of yesterday. The BTC/USD pair went from below $9000 and inside the long-term bearish zone to open today inside the most bullish area of the current scenario.
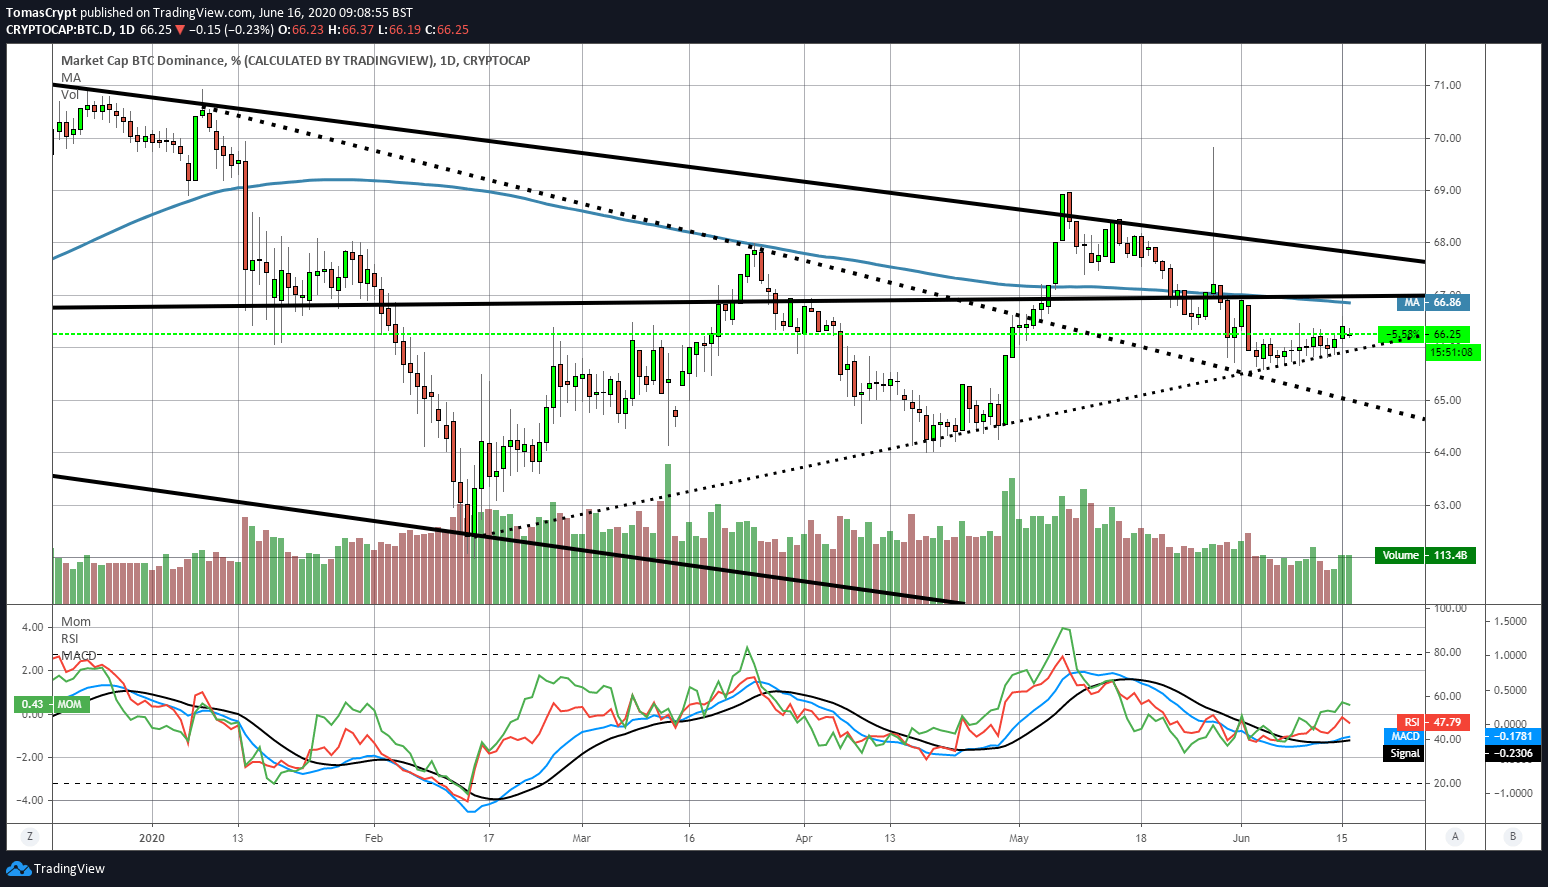
Where yesterday's downward movement did have an impact was on the market's outlook for dominance. Bitcoin returns to the forefront of the competition for market share.
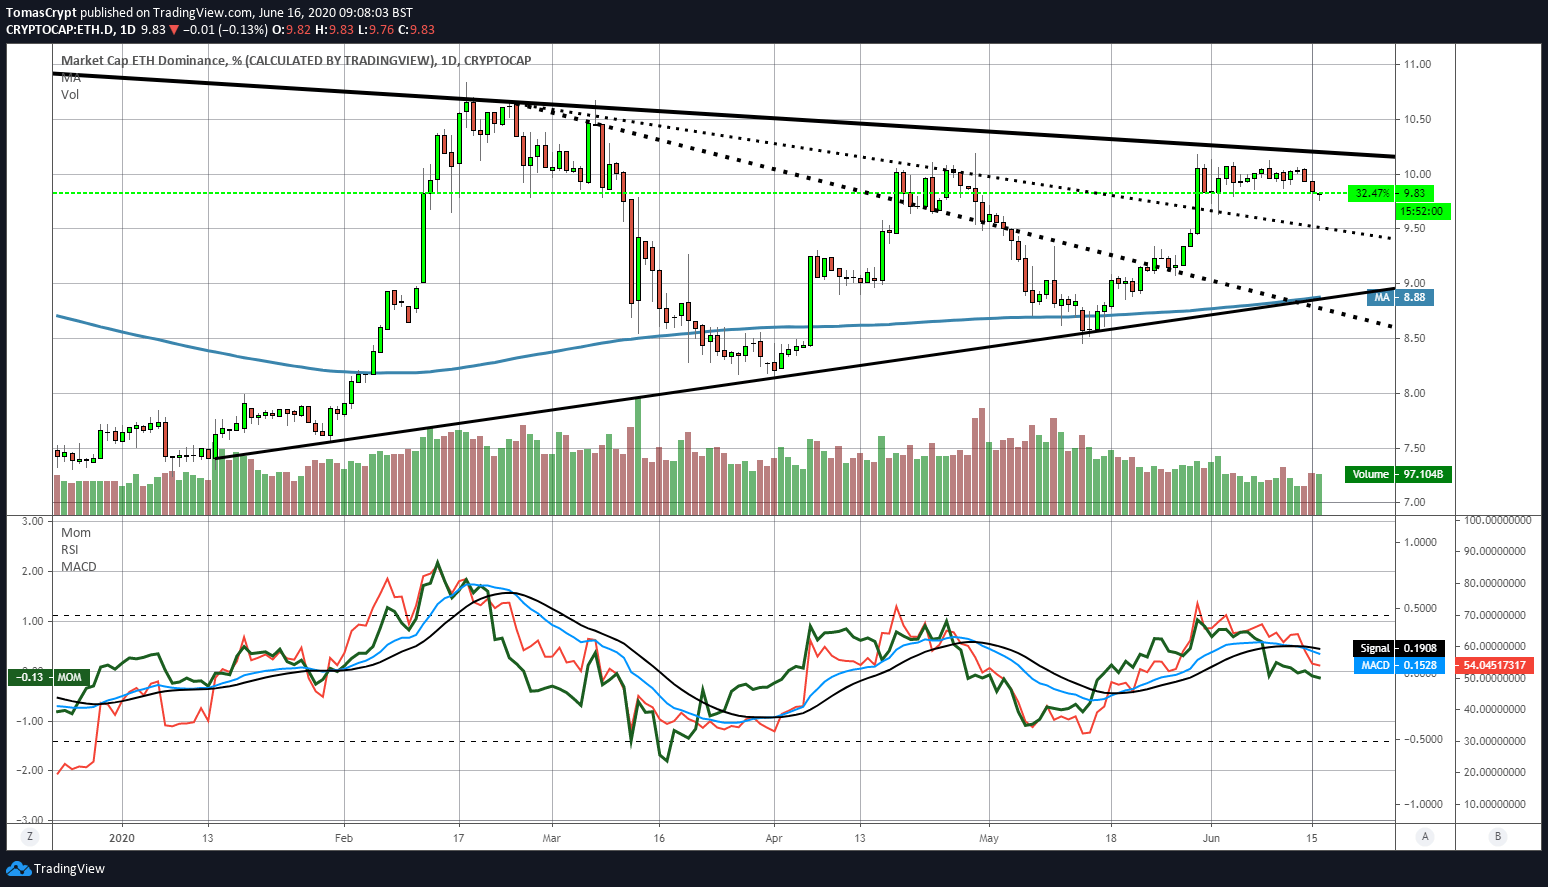
Ethereum's dominance chart shows a tremendous potential fall, which could take Ether's market share from the current 9.78% to 9%, where it would find support and a new opportunity to attack the 10% zone as the border of the fully bullish territory.
Bitcoin now holds 66.28% market share and has two strong technical resistances on the upside. The first is at the 66.86% dominance level and the second, and more importantly, at 67.7%.
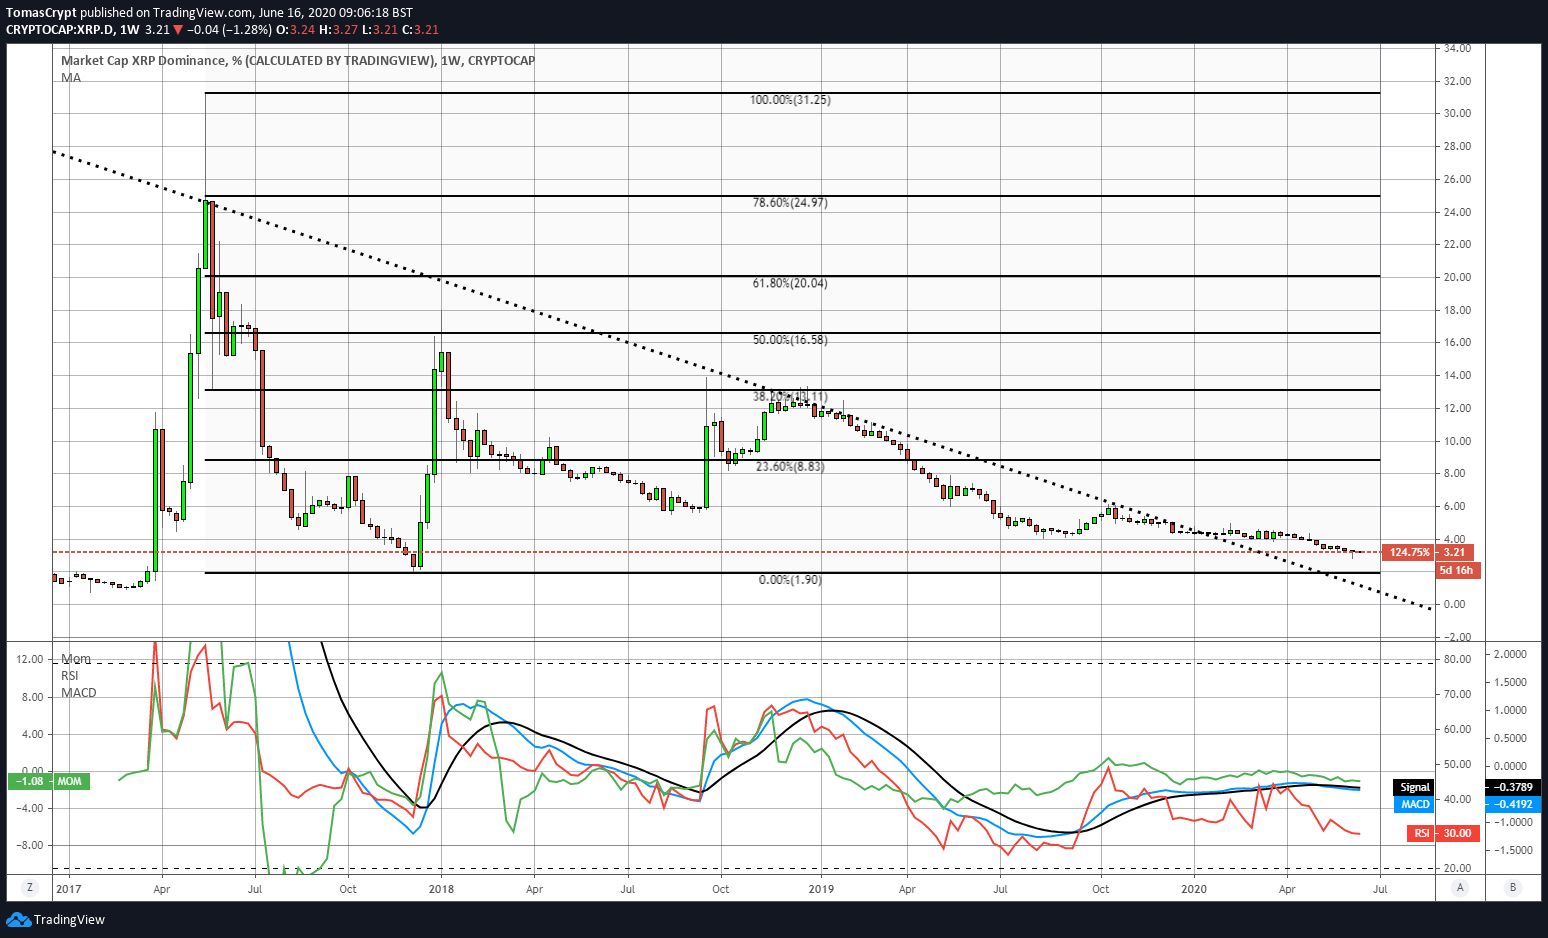
Ripple is still in low hours and continues to lose weight in the overall crypto market. Ripple reached a 30% market share in May 2017, is just over 3% market share and does not look like the trend will change in the short term.
In the Ripple's weekly dominance range chart, we see the strong oversold that it carries. Should the XRP give the market one of its explosive gains, the 8.83% dominance level would be a clear target for the bulls.
As the business of parent company Ripple Ltd expands, planning to reach 350 partnership agreements by 2020, the value of the XRP token continues to devalue and cause disgust among its holders.
Market sentiment is improving slightly after yesterday's scare and is now at level 39. The market continues to be distrustful and is positioned in a fear zone, waiting for a significant breakthrough to lift the bullish dreams again.
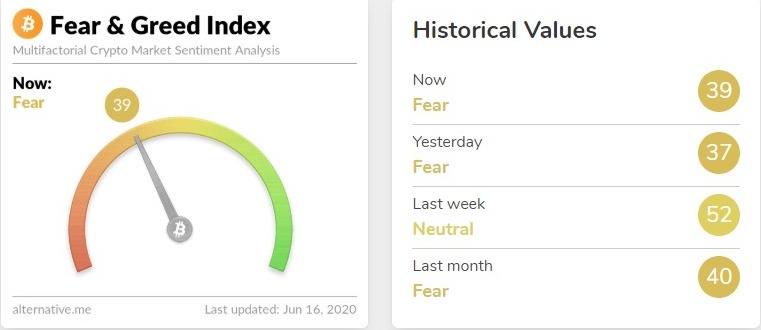
Source: alternative.me
ETH/BTC Daily Chart
The ETH/BTC pair is currently trading at the price level of 0.0245 and remains within the consolidation zone of recent weeks. The positive market reaction today is helping the ETH/BTC pair get closer to its strategic target of 0.0252.
Above the current price, the first resistance level is at 0.0248, then the second at 0.0252 and the third one at 0.0258.
Below the current price, the first support level is at 0.0235, then the second at 0.0225 and the third one at 0.0221.
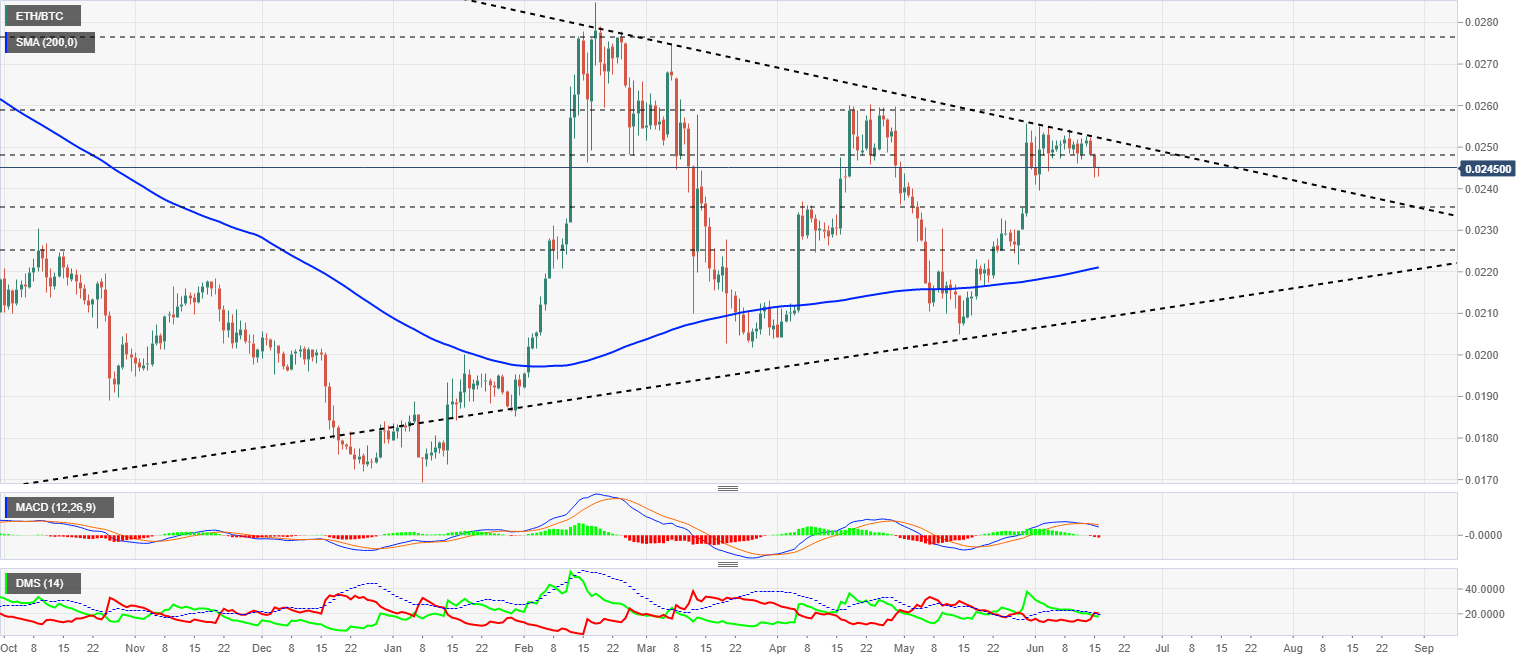
The MACD on the daily chart continues to hold the bearish cross, although it is still in the beginning and has not yet reached a significant level.
The DMI on the daily chart shows the bears losing strength once losing the ADX line support. The bulls are still very close and could attempt to regain control of the pair, but with little chance of success.
BTC/USD Daily Chart
The BTC/USD pair is currently trading at $9469 and is trading at the bottom of the chart's bullish channel. Below the current level, Bitcoin would remain in a vast expansive triangle zone with a range waiting for the January 1, 2021 price to fall between $20300 and $7080.
Above the current price, the first resistance level is at $9600, then the second at $10400 and the third one at $11350.
Below the current price, the first support level is at $9180, then the second at $8800 and the third one at $8700.
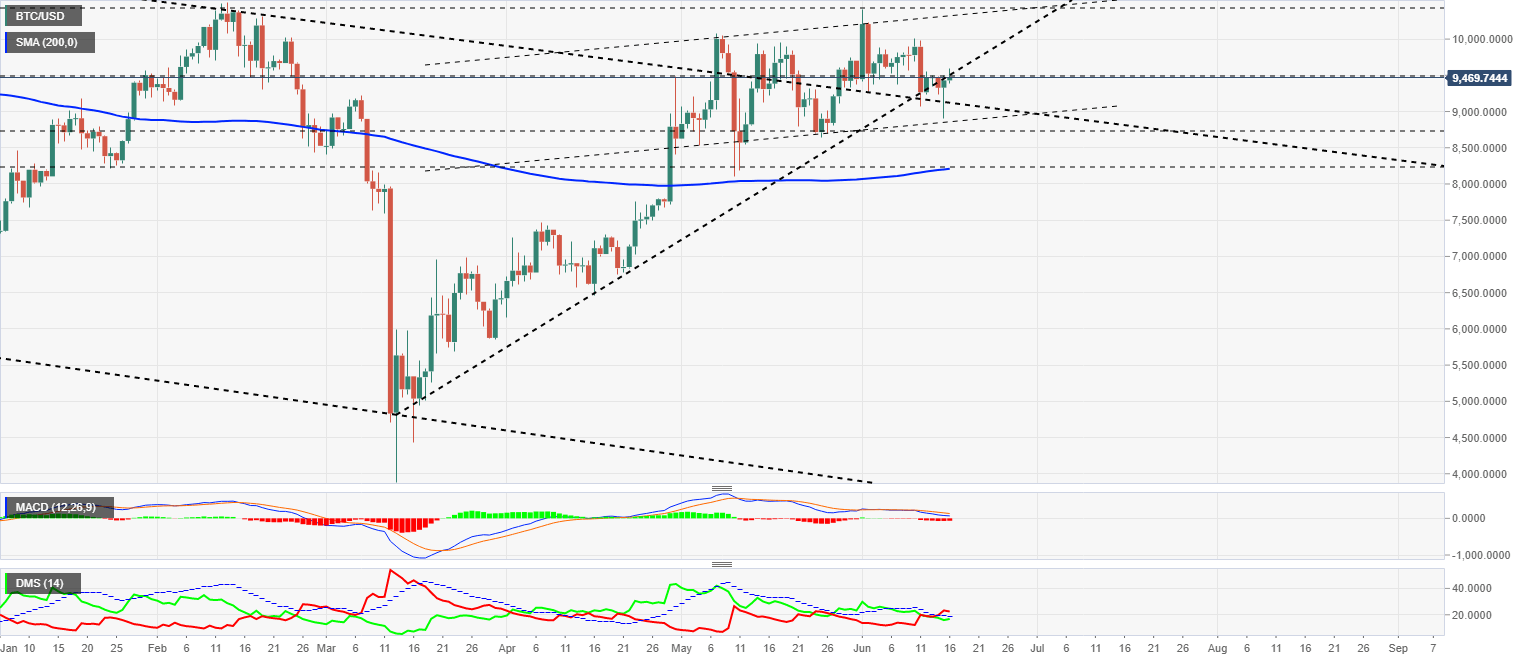
The MACD on the daily chart reduces the bearish profile and is now horizontal, increasing the likelihood of a bullish move in the near term.
The DMI on the daily chart shows the bears above the ADX line, but without a safety margin against a bull attack. The current structure is conducive to a sudden increase in volatility.
ETH/USD Daily Chart
The ETH/USD pair is currently trading at $232.3 and cannot regain support due to price congestion at $235, which casts doubt on today's rise.
Above the current price, the first resistance level is at $235, then the second at $245 and the third one at $265.
Below the current price, the first support level is at $220, then the second at $200 and the third one at $185.
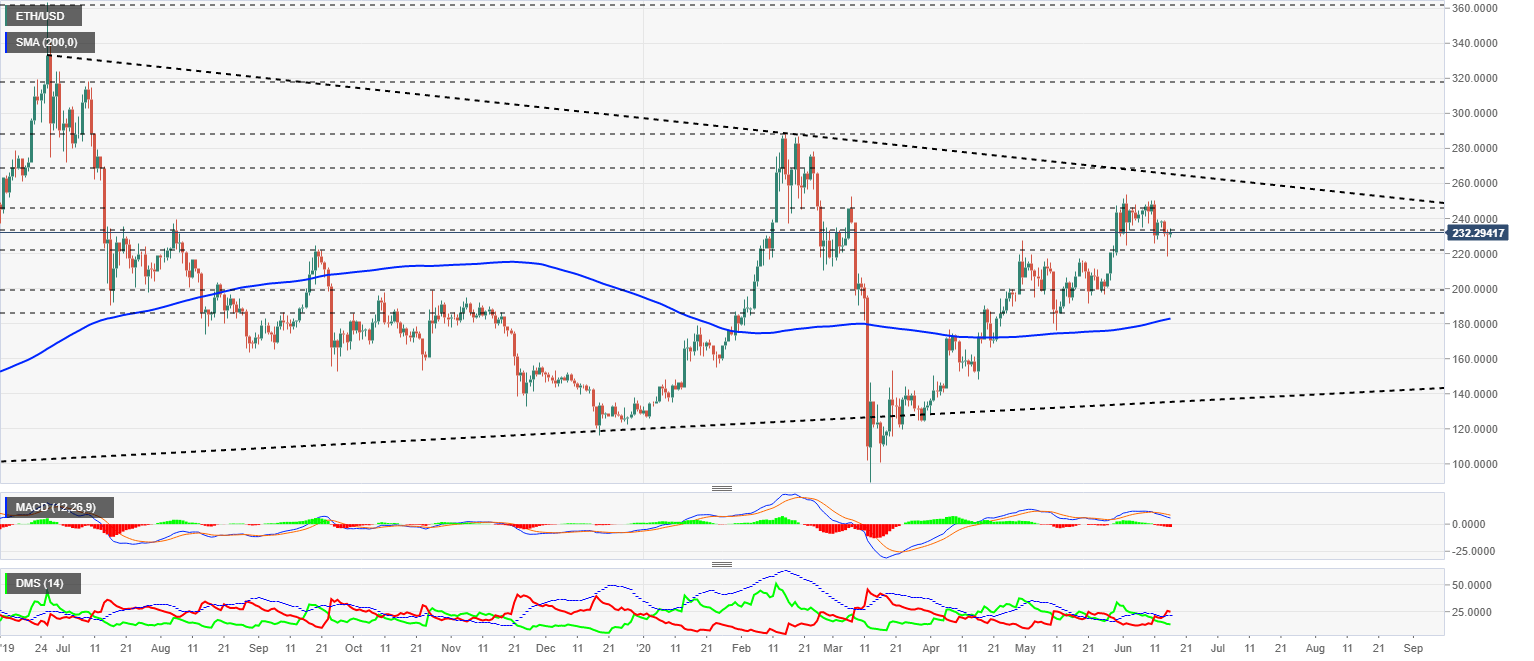
The MACD on the daily chart continues to move lower and could accelerate the declines in the coming sessions.
The DMI on the daily chart shows the bears gaining height above the ADX line, while the bulls are moving decisively lower, giving up any upward momentum.
XRP/USD Daily Chart
The XRP/USD pair is currently trading at $0.1912, anchored to the lateral range that began in April. The technical structure of the XRP chart is a compressive triangle that starts to push the price. The apex of the triangle will be reached in late summer, forcing the XRP/USD pair out of this zone.
Above the current price, the first resistance level is at $0.20, then the second at $0.212 and the third one at $0.235.
Below the current price, the first support level is at $0.18, then the second at $0.164 and the third one at $0.14.
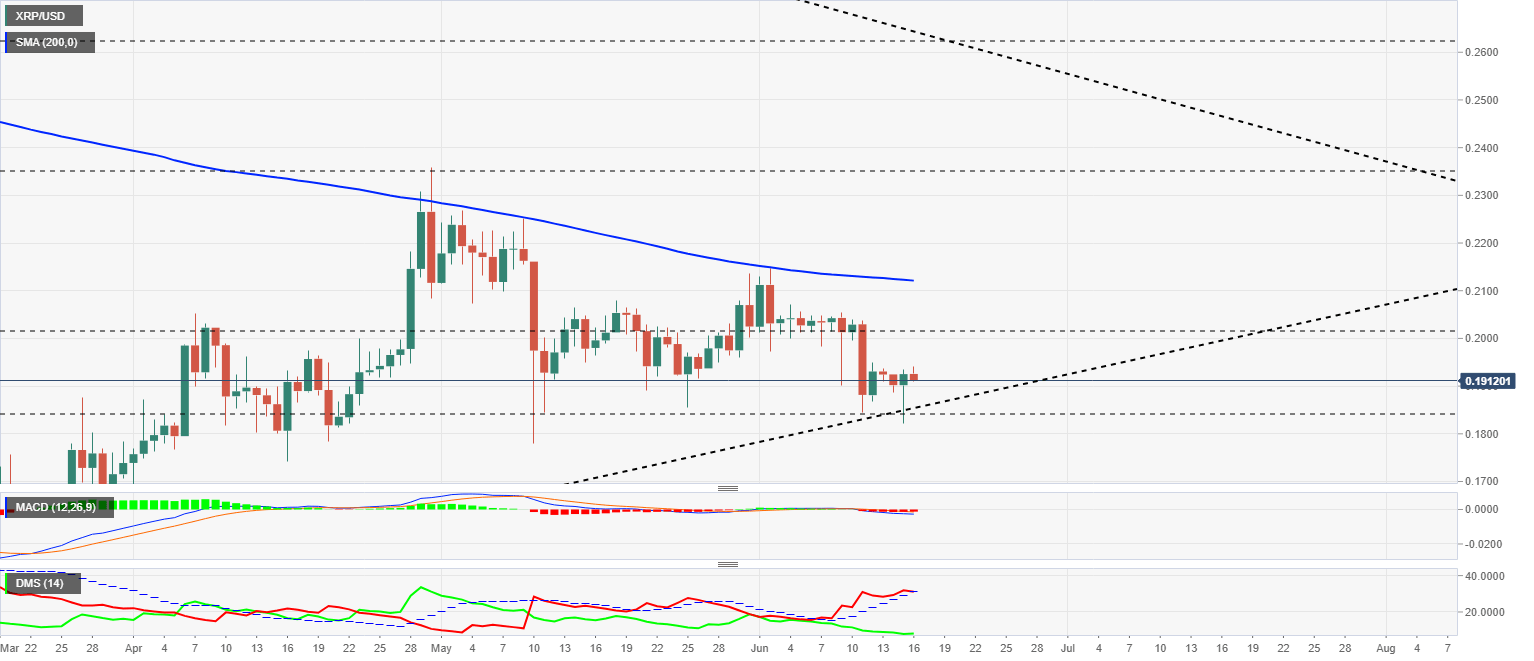
The MACD on the daily chart shows a completely flat profile, with no direction or intensity.
The DMI on the daily chart shows the bears about to lose the support of the ADX line, which would disable the bearish pattern that had dominated the price of the XRP/USD since early May when the price was at $0.235.
Author

Tomas Salles
FXStreet
Tomàs Sallés was born in Barcelona in 1972, he is a certified technical analyst after having completing specialized courses in Spain and Switzerland. He expanded his technical training following the guidance of great experts on the financial markets.


